

Question: matlab 1. (20) Before attempting this problem, please review the if-else and for command videos posted in Blackboard. Draw a flowchart and write a Matlab
matlab
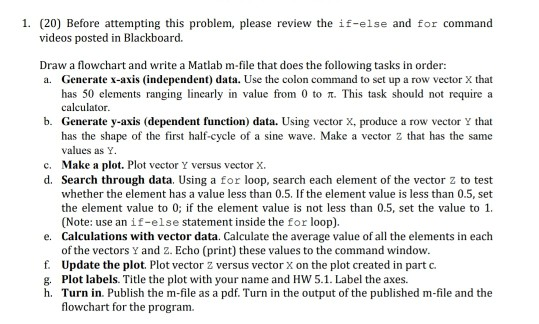
1. (20) Before attempting this problem, please review the if-else and for command videos posted in Blackboard. Draw a flowchart and write a Matlab m-file that does the following tasks in order: a. Generate x-axis (independent) data. Use the colon command to set up a row vector X that has 50 elements ranging linearly in value from 0 to it. This task should not require a calculator b. Generate y-axis (dependent function) data. Using vector X, produce a row vector Y that the shape of the first half-cycle of a sine wave. Make a vector Z that has the same values as Y. c. Make a plot. Plot vector y versus vector X. d. Search through data. Using a for loop, search each element of the vector z to test whether the element has a value less than 0.5. If the element value is less than 0.5, set the element value to 0; if the element value is not less than 0.5, set the value to 1. (Note: use an if-else statement inside the for loop). e. Calculations with vector data. Calculate the average value of all the elements in each of the vectors Y and 2. Echo (print) these values to the command window. f. Update the plot. Plot vector 2 versus vector X on the plot created in part g. Plot labels. Title the plot with your name and HW 5.1. Label the axes. h. Turn in. Publish the m-file as a pdf. Turn in the output of the published m-file and the flowchart for the program
Step by Step Solution
There are 3 Steps involved in it

Get step-by-step solutions from verified subject matter experts