

Question: MATLAB 2. Create a stem plot of a sampled sine-wave. You should plot at least one cycle. The phase advance per sample (w) should be:
MATLAB
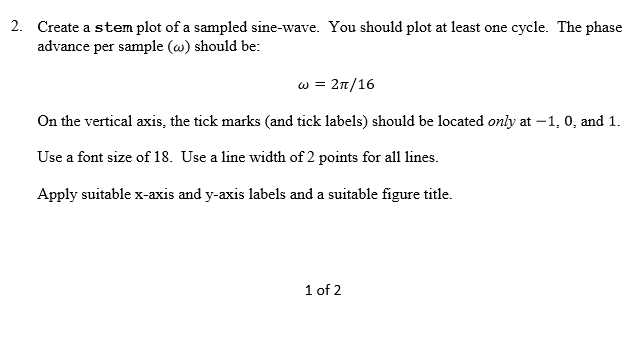
2. Create a stem plot of a sampled sine-wave. You should plot at least one cycle. The phase advance per sample (w) should be: = 2 /16 On the vertical axis, the tick marks (and tick labels) should be located only at -1, 0, and 1 Use a font size of 18. Use a line width of 2 points for all lines. Apply suitable x-axis and y-axis labels and a suitable figure title 1 of 2
Step by Step Solution
There are 3 Steps involved in it
1 Expert Approved Answer
Step: 1 Unlock

Question Has Been Solved by an Expert!
Get step-by-step solutions from verified subject matter experts
Step: 2 Unlock
Step: 3 Unlock