

Question: matlab 22. The U.S. population in selected years between 1815 and 1965 is listed in the table below. Determine a quadratic equation in the form
matlab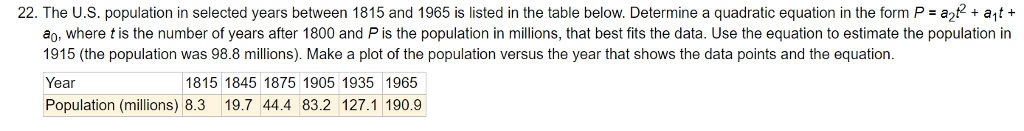
22. The U.S. population in selected years between 1815 and 1965 is listed in the table below. Determine a quadratic equation in the form P a2t+ at+ ao, where t is the number of years after 1800 and P is the population in millions, that best fits the data. Use the equation to estimate the population in 1915 (the population was 98.8 millions). Make a plot of the population versus the year that shows the data points and the equation. Year Population (millions) 8.3 19.7 44.4 83.2 127.1 190.9 1815 1845 1875 1905 1935 1965 22. The U.S. population in selected years between 1815 and 1965 is listed in the table below. Determine a quadratic equation in the form P a2t+ at+ ao, where t is the number of years after 1800 and P is the population in millions, that best fits the data. Use the equation to estimate the population in 1915 (the population was 98.8 millions). Make a plot of the population versus the year that shows the data points and the equation. Year Population (millions) 8.3 19.7 44.4 83.2 127.1 190.9 1815 1845 1875 1905 1935 1965
Step by Step Solution
There are 3 Steps involved in it

Get step-by-step solutions from verified subject matter experts