

Question: MATLAB ASAP !!! Data collected in an experiment are given in the table: You are expected to fit a curve to this data. You first
MATLAB ASAP !!!
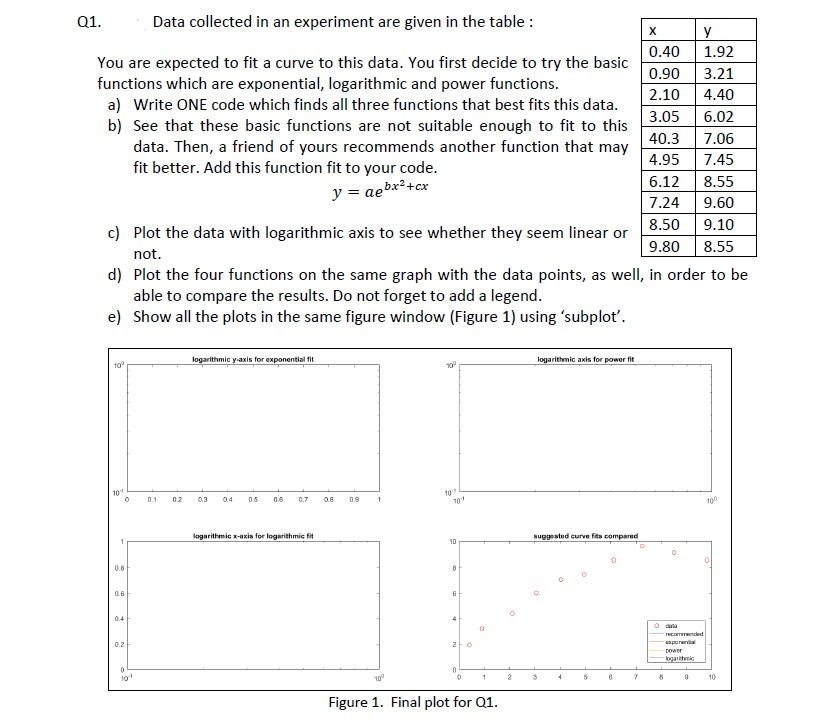
Data collected in an experiment are given in the table: You are expected to fit a curve to this data. You first decide to try the basic functions which are exponential, logarithmic and power functions. Write ONE code which finds all three functions that best fits this data. See that these basic functions are not suitable enough to fit to this data. Then, a friend of yours recommends another function that may fit better. Add this function fit to your code. y = ae^bx^2 + cx Plot the data with logarithmic axis to see whether they seem linear or not. Plot the four functions on the same graph with the data points, as well, in order to be able to compare the results. Do not forget to add a legend. Show all the plots in the same figure window (Figure 1) using 'subplot
Step by Step Solution
There are 3 Steps involved in it

Get step-by-step solutions from verified subject matter experts