

Question: Matlab assignment Exercise 1 Use ode45 as in Example2 to plot a solution to the initial-value problem Extend the time interval to [O, 50] then
 Matlab assignment
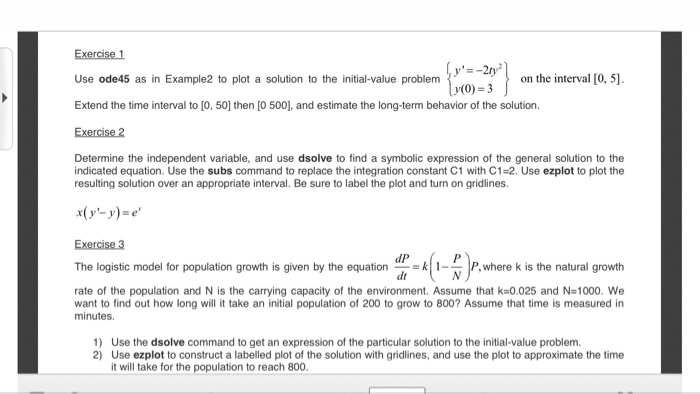
 Exercise 1 Use ode45 as in Example2 to plot a solution to the initial-value problem Extend the time interval to [O, 50] then [O 500], and estimate the long-term behavior of the solution. Exercise 2 03on the interal 10. 51. Determine the independent variable, and use dsolve to find a symbolic expression of the general solution to the indicated equation. Use the subs command to replace the integration constant C1 with C1-2. Use ezplot to plot the resulting solution over an appropriate interval. Be sure to label the plot and turn on gridlines. (-y-e Exercise 3 The logistic model for population growth is given by the equationere k is the natural growth rate of the population and N is the carrying capacity of the environment. Assume that k 0.025 and N-1000. We want to find out how long will it take an initial population of 200 to grow to 800? Assume that time is measured in minutes. Use the dsolve command to get an expression of the particular solution to the initial-value problem. 1) 2) Use ezplot to construct a labelled plot of the solution with gridlines, and use the plot to approximate the time t will take for the population to reach 800
Step by Step Solution
There are 3 Steps involved in it

Get step-by-step solutions from verified subject matter experts