

Question: Matlab code %% #1 % % WRITE CODE BELOW: % Generate two separate plots: y=x^2 on the interval [0,1], and y=1/x on % the interval
Matlab code
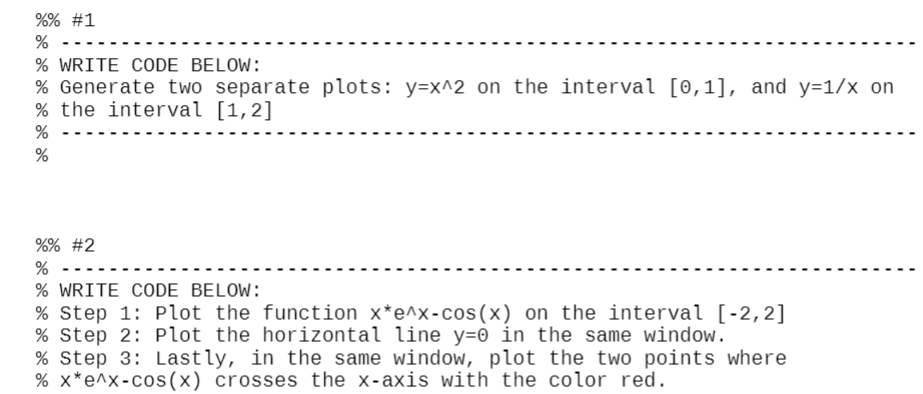
%% #1 % % WRITE CODE BELOW: % Generate two separate plots: y=x^2 on the interval [0,1], and y=1/x on % the interval [1,2] % % %% #2 % % WRITE CODE BELOW: % Step 1: Plot the function x*e^x-cos(x) on the interval [-2,2] % Step 2: Plot the horizontal line y=0 in the same window. % Step 3: Lastly, in the same window, plot the two points where % x*e^x-cos(x) crosses the x-axis with the color red
Step by Step Solution
There are 3 Steps involved in it
1 Expert Approved Answer
Step: 1 Unlock

Question Has Been Solved by an Expert!
Get step-by-step solutions from verified subject matter experts
Step: 2 Unlock
Step: 3 Unlock