

Question: MATLab code for part b and c only... Please do as soon as possible Thanks 2. If hunters are allowed to kill at a rate
MATLab code for part b and c only... Please do as soon as possible Thanks
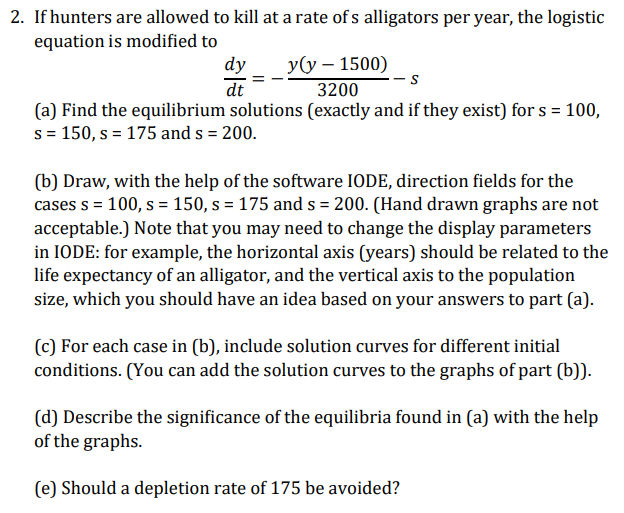
2. If hunters are allowed to kill at a rate of s alligators per year, the logistic equation is modified to dy y(y - 1500) -S dt 3200 (a) Find the equilibrium solutions (exactly and if they exist) for s = 100, s = 150, s = 175 and s = 200. (b) Draw, with the help of the software IODE, direction fields for the cases s = 100, s = 150, s = 175 and s = 200. (Hand drawn graphs are not acceptable.) Note that you may need to change the display parameters in IODE: for example, the horizontal axis (years) should be related to the life expectancy of an alligator, and the vertical axis to the population size, which you should have an idea based on your answers to part (a). (c) For each case in (b), include solution curves for different initial conditions. (You can add the solution curves to the graphs of part (b)). (d) Describe the significance of the equilibria found in (a) with the help of the graphs. (e) Should a depletion rate of 175 be avoided? 2. If hunters are allowed to kill at a rate of s alligators per year, the logistic equation is modified to dy y(y - 1500) -S dt 3200 (a) Find the equilibrium solutions (exactly and if they exist) for s = 100, s = 150, s = 175 and s = 200. (b) Draw, with the help of the software IODE, direction fields for the cases s = 100, s = 150, s = 175 and s = 200. (Hand drawn graphs are not acceptable.) Note that you may need to change the display parameters in IODE: for example, the horizontal axis (years) should be related to the life expectancy of an alligator, and the vertical axis to the population size, which you should have an idea based on your answers to part (a). (c) For each case in (b), include solution curves for different initial conditions. (You can add the solution curves to the graphs of part (b)). (d) Describe the significance of the equilibria found in (a) with the help of the graphs. (e) Should a depletion rate of 175 be avoided
Step by Step Solution
There are 3 Steps involved in it

Get step-by-step solutions from verified subject matter experts