

Question: MATLAB CODE Generate & plot 100 samples of sinusoids in range (0, 2) of: y1+0.2xy2 where: f1 = 0.5 Hz & f2 = 10 Hz
MATLAB CODE
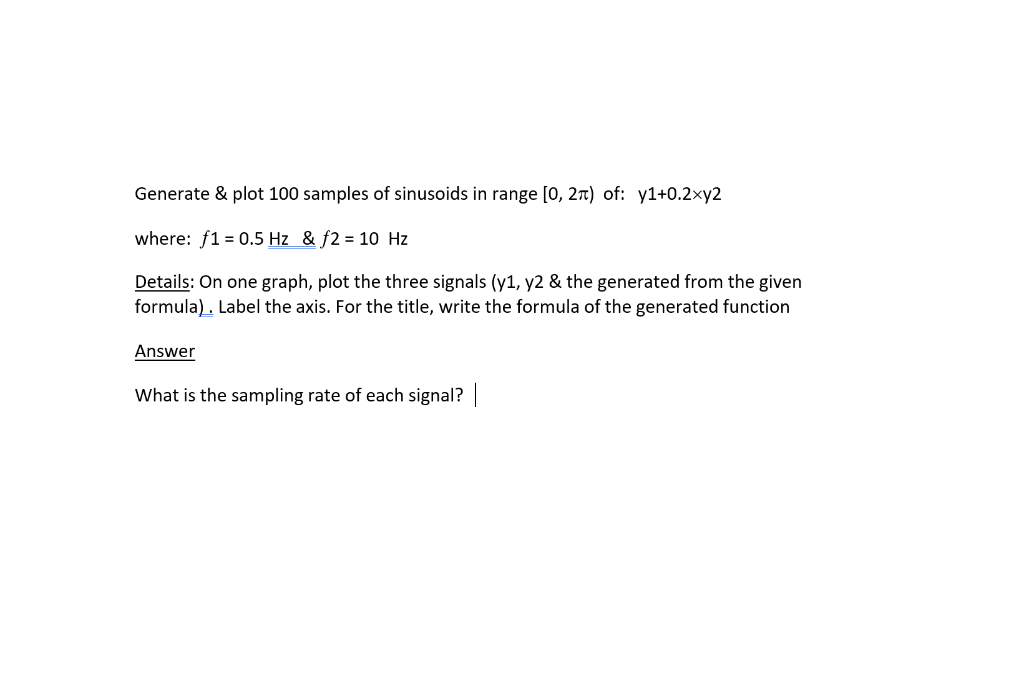
Generate & plot 100 samples of sinusoids in range (0, 2) of: y1+0.2xy2 where: f1 = 0.5 Hz & f2 = 10 Hz Details: On one graph, plot the three signals (y1, y2 & the generated from the given formula). Label the axis. For the title, write the formula of the generated function Answer What is the sampling rate of each signal? |
Step by Step Solution
There are 3 Steps involved in it
1 Expert Approved Answer
Step: 1 Unlock

Question Has Been Solved by an Expert!
Get step-by-step solutions from verified subject matter experts
Step: 2 Unlock
Step: 3 Unlock