

Question: MATLAB CODE Instructions: Complete and submit the following All-Class Assignment. You should feel comfortable discussing any aspect of the assignment with anyone in the course
 MATLAB CODE
Instructions: Complete and submit the following All-Class Assignment. You should feel comfortable discussing any aspect of the assignment with anyone in the course including developing conceptual insight or developing a solution. However, you are expected to prepare your own solution for submission.
Problems:
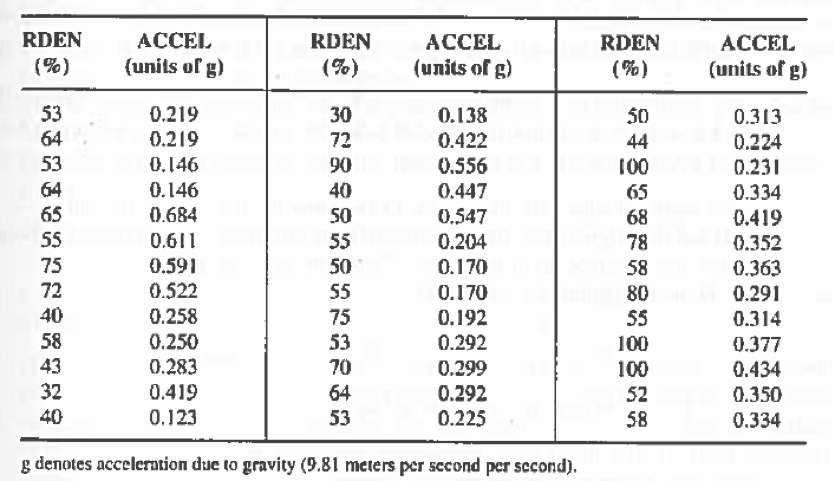
1.Measurements of engineering interest have been recorded during earthquakes throughout the world from 1802 to the present. One of the critical readings taken is apparent relative density RDEN it relates to the potential for the soil to behave like a liquid under shaking (a liquefied soil cannot support a building foundation, and hence the building will fall down.) RDEN is dimensionless and is reported in percentage units. Another critical reading is the peak surface acceleration ACCEL; the higher ACCEL is, the greater the force on the buildings. ACCEL is measured in units of g (gravitational acceleration).
Compute the descriptive statistics (mean, median, mode, max, min, upper and lower quartiles, variance, standard deviation, range, and interquartile range) for the RDEN and ACCEL data. Plot histograms for both data sets. Submit your Matlab code and results.
2.After 28 days, concrete is considered to have reached its cured strength. For 28-day concrete cube tests, the following data were obtained from a concrete testing lab:
Maximum load (kN)
| 950 | 972 | 981 | 895 | 908 | 995 | 646 | 987 | 940 | 937 | 846 | 947 | 827 | 961 | 935 | 956 |
Compressive strength (N/mm2)
| 42.25 | 43.25 | 43.50 | 39.25 | 40.25 | 44.25 | 28.75 | 44.25 | 41.75 | 41.75 | 38.00 | 42.50 | 36.75 | 42.75 | 42.00 | 33.50 |
Compute the descriptive statistics (mean, median, mode, max, min, upper and lower quartiles, variance, standard deviation, range, and interquartile range) for the RDEN and ACCEL data. Plot histograms for both data sets. Plot a scatter plot of load vs. strength. Submit your Matlab code and results. Can you make any comment on the observed results.
147 -23315 32234332 3 3 4 3 3 i-0000000000000 DE %) 50 44 00 58 805 667585 2 826774002292 325 7799 s-1454 ni | 00 0. 0 0 0 0 0 0 0 0 0 0 521112222 0 LI 200050553043 555757 E | 996641128039 221166552224] i-0000000000000 5520832 5774543
Step by Step Solution
There are 3 Steps involved in it

Get step-by-step solutions from verified subject matter experts