

Question: matlab code +output The following scores were recorded for a given course: G=[58,93,71,60,85,72,67,35,66,95,52,81,96,68,86,58,82,65,93,83] Write an m-file to represent the distribution of grades graphically (use comments
matlab code +output 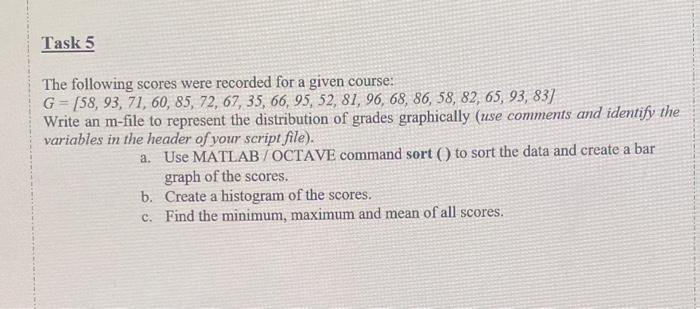
The following scores were recorded for a given course: G=[58,93,71,60,85,72,67,35,66,95,52,81,96,68,86,58,82,65,93,83] Write an m-file to represent the distribution of grades graphically (use comments and identify the variables in the header of your script file). a. Use MATLAB / OCTAVE command sort () to sort the data and create a bar graph of the scores. b. Create a histogram of the scores. c. Find the minimum, maximum and mean of all scores
Step by Step Solution
There are 3 Steps involved in it
1 Expert Approved Answer
Step: 1 Unlock

Question Has Been Solved by an Expert!
Get step-by-step solutions from verified subject matter experts
Step: 2 Unlock
Step: 3 Unlock