

Question: MATLAB CODE % PLEASE ANNOTATE EACH LINE TO BETTER UNDERSTAND WHAT EACH LINE DOES. Thank you. Create your own image, of size 256 x 256
MATLAB CODE
% PLEASE ANNOTATE EACH LINE TO BETTER UNDERSTAND WHAT EACH LINE DOES.
 Thank you.
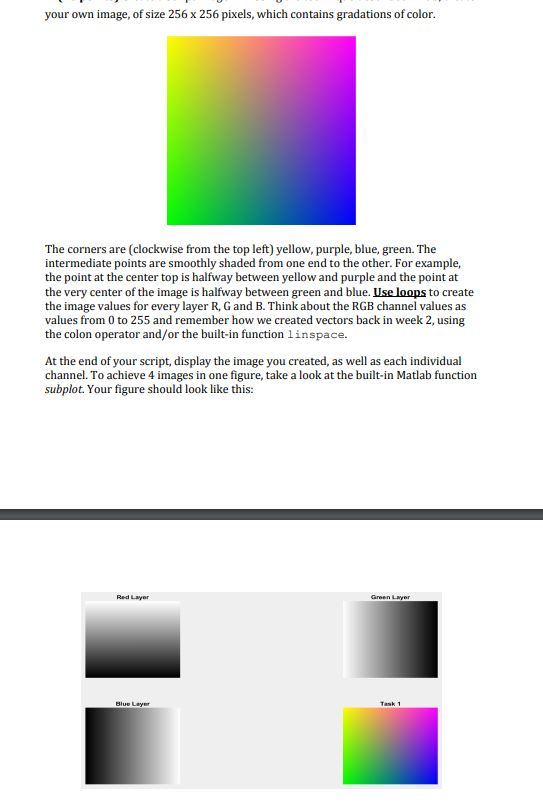
Create your own image, of size 256 x 256 pixels, which contains gradations of color. The corners are (clockwise from the top left) yellow, purple, blue, green. The intermediate points are smoothly shaded from one end to the other. For example, the point at the center top is halfway between yellow and purple and the point at the very center of the image is halfway between green and blue. Use loops to create the image values for every layer R, G and B. Think about the RGB channel values as values from 0 to 255 and remember how we created vectors back in week 2, using the colon operator and/or the built-in function linspace. At the end of your script, display the image you created, as well as each individual channel. To achieve 4 images in one figure, take a look at the built-in Matlab function subplot. Your figure should look like this:
your own image, of size 256 x 256 pixels, which contains gradations of color The corners are (clockwise from the top left) yellow, purple, blue, green. The intermediate points are smoothly shaded from one end to the other. For example, the point at the center top is halfway between yellow and purple and the point at the very center of the image is halfway between green and blue. seloops to create the image values for every layer R, G and B. Think about the RGB channel values as values from 0 to 255 and remember how we created vectors back in week 2, using the colon operator and/or the built-in function linspace. At the end of your script, display the image you created, as well as each individual channel. To achieve 4 images in one figure, take a look at the built-in Matlab function subplot. Your figure should look like this: your own image, of size 256 x 256 pixels, which contains gradations of color The corners are (clockwise from the top left) yellow, purple, blue, green. The intermediate points are smoothly shaded from one end to the other. For example, the point at the center top is halfway between yellow and purple and the point at the very center of the image is halfway between green and blue. seloops to create the image values for every layer R, G and B. Think about the RGB channel values as values from 0 to 255 and remember how we created vectors back in week 2, using the colon operator and/or the built-in function linspace. At the end of your script, display the image you created, as well as each individual channel. To achieve 4 images in one figure, take a look at the built-in Matlab function subplot. Your figure should look like this
Step by Step Solution
There are 3 Steps involved in it

Get step-by-step solutions from verified subject matter experts