

Question: MATLAB CODE want the matlab code from you. In a way that works. - Plot the graphs of x(t) and y(t) according to t in
MATLAB CODE
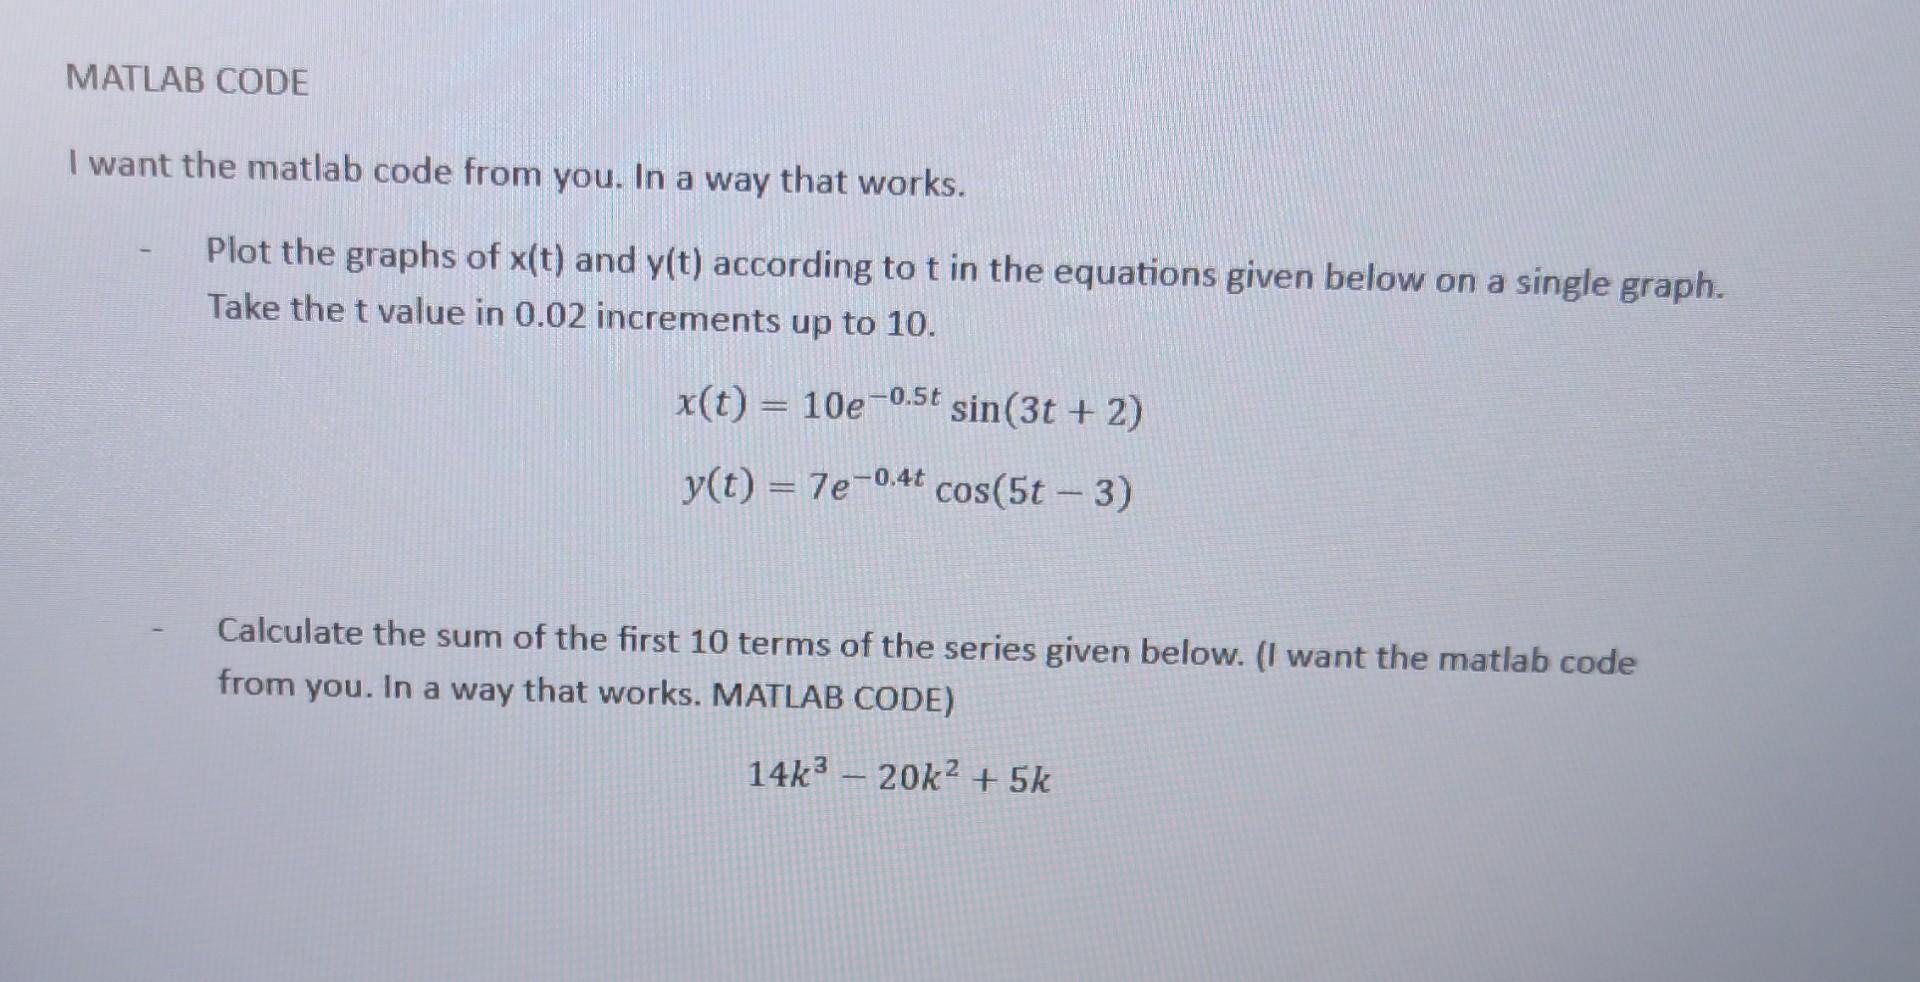
want the matlab code from you. In a way that works. - Plot the graphs of x(t) and y(t) according to t in the equations given below on a single graph. Take the t value in 0.02 increments up to 10. x(t)=10e0.5tsin(3t+2)y(t)=7e0.4tcos(5t3) - Calculate the sum of the first 10 terms of the series given below. (I want the matlab code from you. In a way that works. MATLAB CODE) 14k320k2+5k
Step by Step Solution
There are 3 Steps involved in it
1 Expert Approved Answer
Step: 1 Unlock

Question Has Been Solved by an Expert!
Get step-by-step solutions from verified subject matter experts
Step: 2 Unlock
Step: 3 Unlock