

Question: MATLAB CODING QUESTION: NO DATA FILE NEEDED. Just need general form for the code when we have a large matrix X = [X1X2 . .
MATLAB CODING QUESTION:
NO DATA FILE NEEDED. Just need general form for the code when we have a large matrix X = [X1X2 . . . XC] R nCk where Xc R nk is the data for each of the
classes c = 1, 2, . . . , C. C = 5 and k = 100 in all the examples, but n changes. Please use matlab code that is required and include all code in answer.
Thanks!
Tags: computer science machine learning engineering matlab mat lab mathlab math statistics plot coding code simulated fda fliplr flippud
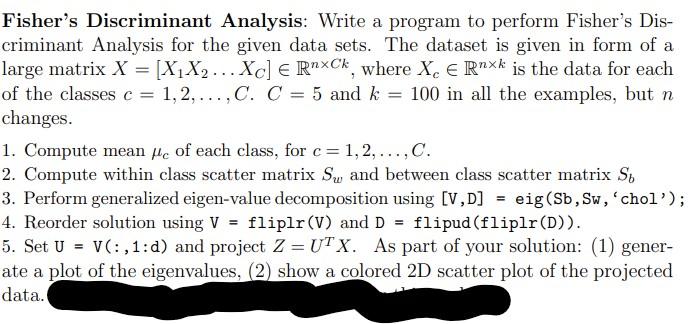
TEXT FROM PHOTO:Fishers Discriminant Analysis: Write a program to perform Fishers Discriminant Analysis for the given data sets. The dataset is given in form of a large matrix X = [X1X2 . . . XC] R nCk, where Xc R nk is the data for each of the classes c = 1, 2, . . . , C. C = 5 and k = 100 in all the examples, but n changes. 1. Compute mean c of each class, for c = 1, 2, . . . , C. 2. Compute within class scatter matrix Sw and between class scatter matrix Sb 3. Perform generalized eigen-value decomposition using [V,D] = eig(Sb,Sw,chol); 4. Reorder solution using V = fliplr(V) and D = flipud(fliplr(D)). 5. Set U = V(:,1:d) and project Z = U T X. As part of your solution: (1) generate a plot of the eigenvalues, (2) show a colored 2D scatter plot of the projected data
Fisher's Discriminant Analysis: Write a program to perform Fisher's Discriminant Analysis for the given data sets. The dataset is given in form of a large matrix X=[X1X2XC]RnCk, where XcRnk is the data for each of the classes c=1,2,,C. C=5 and k=100 in all the examples, but n changes. 1. Compute mean c of each class, for c=1,2,,C. 2. Compute within class scatter matrix Sw and between class scatter matrix Sb 3. Perform generalized eigen-value decomposition using [V,D]= eig (Sb,Sw, 'chol') ; 4. Reorder solution using V=fliplr(V) and D=flipud(fliplr(D) ). 5. Set U=V(:,1:d) and project Z=UTX. As part of your solution: (1) generate a plot of the eigenvalues, (2) show a colored 2D scatter plot of the projected
Step by Step Solution
There are 3 Steps involved in it

Get step-by-step solutions from verified subject matter experts