

Question: Matlab - Computer Science If we plot the pie chart for the values given in the vector X = [x 2x 3x), where x is
Matlab - Computer Science
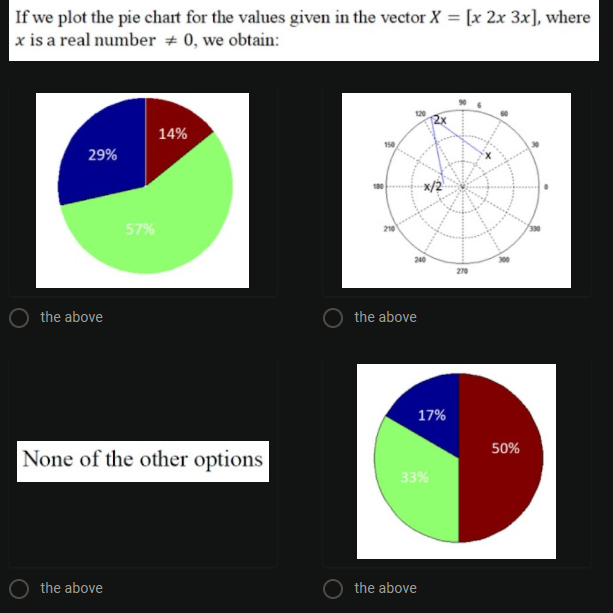
If we plot the pie chart for the values given in the vector X = [x 2x 3x), where x is a real number = 0, we obtain: 120 14% 29% 30 / X/2 57% 210 0 240 270 the above the above 17% 50% None of the other options 33% the above the above
Step by Step Solution
There are 3 Steps involved in it
1 Expert Approved Answer
Step: 1 Unlock

Question Has Been Solved by an Expert!
Get step-by-step solutions from verified subject matter experts
Step: 2 Unlock
Step: 3 Unlock