

Question: Matlab: Create a 2-D plot of this function as u varies from 0 to 2pi. Create a 3-D line plot using function plot3 as u
Matlab: Create a 2-D plot of this function as u varies from 0 to 2pi. Create a 3-D line plot using function plot3 as u varies from 0 to 2pi.
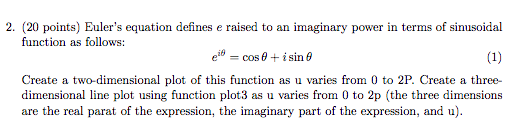
2. (20 points) Euler's equation defines e raised to an imaginary powe in terms of sinusoidal r function as follows: e cos 69 i sin (1) Create a two-dimensional plot of this function as u varies from 0 to 2P. Create a three dimensional line plot using function plot3 as u varies from 0 to 2p (the three dimensions are the real parat of the expression, the imaginary part of the expression, and u)
Step by Step Solution
There are 3 Steps involved in it
1 Expert Approved Answer
Step: 1 Unlock

Question Has Been Solved by an Expert!
Get step-by-step solutions from verified subject matter experts
Step: 2 Unlock
Step: 3 Unlock