

Question: MATLAB Create two sets of subplots using x-values from -pi to +pi. The first set should have 3 rows and 1 column, and contain the
 MATLAB
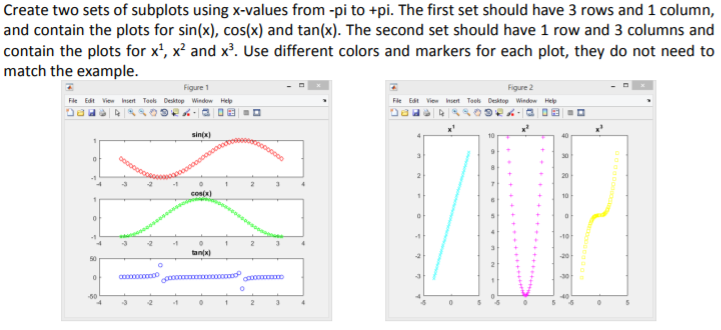
Create two sets of subplots using x-values from -pi to +pi. The first set should have 3 rows and 1 column, and contain the plots for sin(x), cos(x) and tan(x). The second set should have 1 row and 3 columns and contain the plots for x^1, x^2 and x^3. Use different colors and markers for each plot, they do not need to match the example
Step by Step Solution
There are 3 Steps involved in it
1 Expert Approved Answer
Step: 1 Unlock

Question Has Been Solved by an Expert!
Get step-by-step solutions from verified subject matter experts
Step: 2 Unlock
Step: 3 Unlock