

Question: MATLAB. Explain please & thanks 1) You want to plot the functionfx)sin(x) cos(x) on the interval [-1,1]. You are given the code for this function
MATLAB. Explain please & thanks
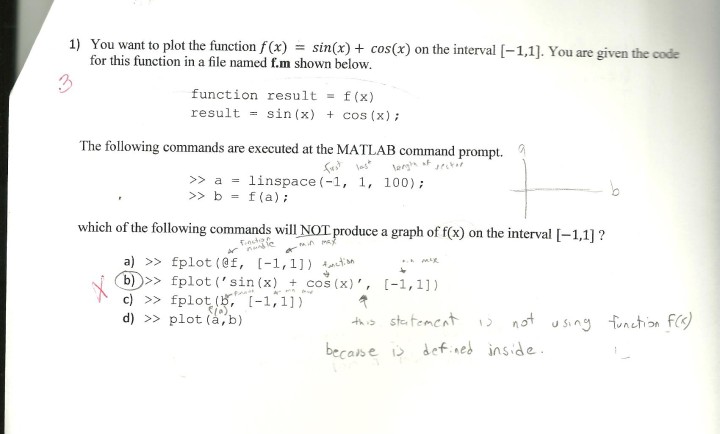
1) You want to plot the functionfx)sin(x) cos(x) on the interval [-1,1]. You are given the code for this function in a file named f.m shown below 3 function result f(x) resultsin (x) cos (x); The following commands are executed at the MATLAB command p rompt. >> a = linspace(-1, >> b = f(a); 1, 100); which of the following commandsl Opdce a graph of fo) on the interval -1.1]? a) >> fplot ( @f, [-1,1)) " >> fplot ('sin(x) t cos (x)', c) >>fplot (b, [-1,1]) d) >> plot (,b) [-1,1]) def nes inside Cais e
Step by Step Solution
There are 3 Steps involved in it
1 Expert Approved Answer
Step: 1 Unlock

Question Has Been Solved by an Expert!
Get step-by-step solutions from verified subject matter experts
Step: 2 Unlock
Step: 3 Unlock