

Question: MATLAB FFT question The provided Data.mat file contains the values of a function f(t) at values of t (also provided in the .mat file). The
MATLAB FFT question
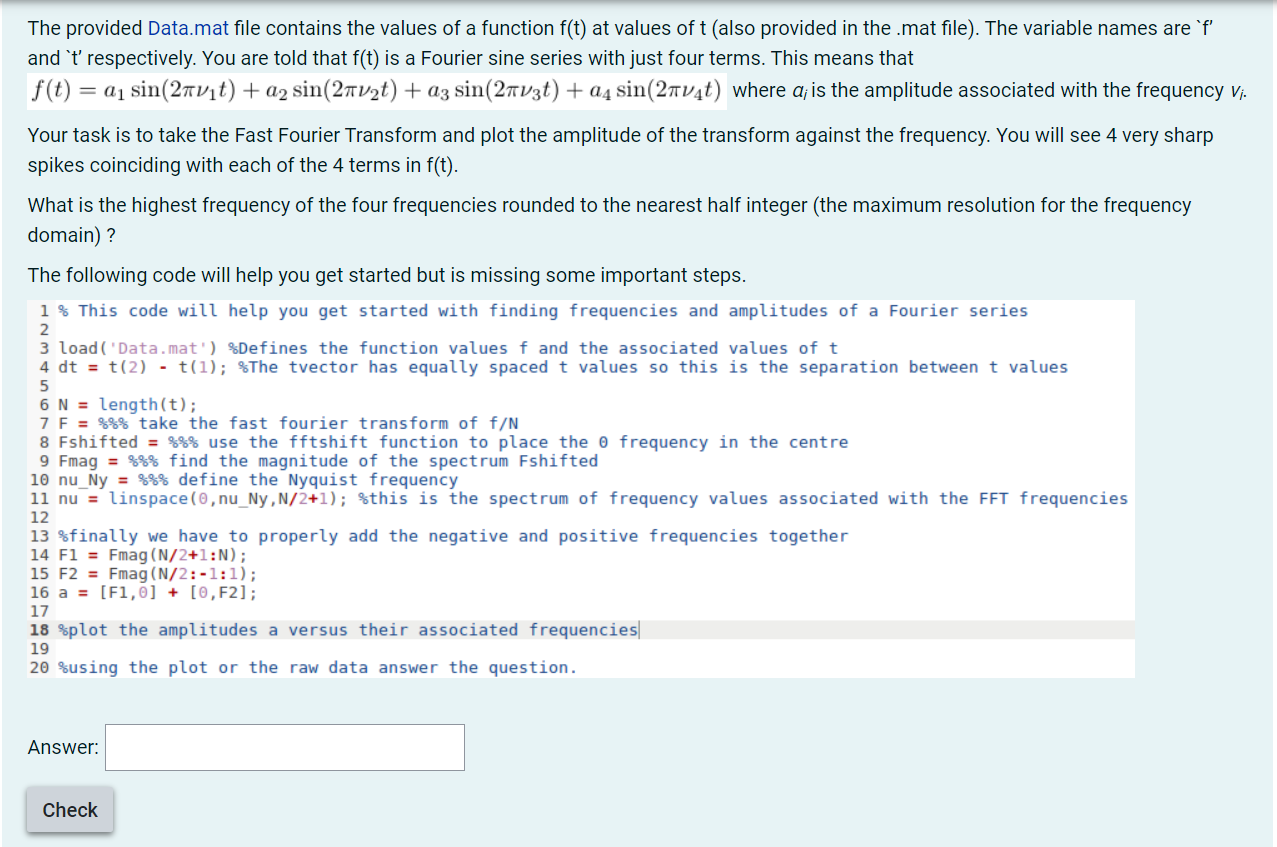
The provided Data.mat file contains the values of a function f(t) at values of t (also provided in the .mat file). The variable names are 'f' and 't' respectively. You are told that f(t) is a Fourier sine series with just four terms. This means that f(t) = a1 sin(27 vt) + a2 sin(27v2t) + az sin(27v3t) + a4 sin(21v4t) where a is the amplitude associated with the frequency Vi. Your task is to take the Fast Fourier Transform and plot the amplitude of the transform against the frequency. You will see 4 very sharp spikes coinciding with each of the 4 terms in f(t). What is the highest frequency of the four frequencies rounded to the nearest half integer (the maximum resolution for the frequency domain)? The following code will help you get started but is missing some important steps. 1 % This code will help you get started with finding frequencies and amplitudes of a Fourier series 2 3 load('Data.mat') Defines the function values f and the associated values of t 4 dt = t(2) - t(1); %The tvector has equally spaced t values so this is the separation between t values 5 6 N = length(t); 7 F = %%% take the fast fourier transform of f/N 8 Fshifted = 88% use the fftshift function to place the frequency in the centre 9 Fmag = %%% find the magnitude of the spectrum Fshifted 10 nu_Ny = %%% define the Nyquist frequency 11 nu = linspace(0,nu_Ny,N/2+1); $this is the spectrum of frequency values associated with the FFT frequencies 12 13 %finally we have to properly add the negative and positive frequencies together 14 F1 = Fmag (N/2+1:N); 15 F2 = Fmag (N/2:-1:1); 16 a = [F1,0] + [,F2]; 17 18 Splot the amplitudes a versus their associated frequencies 19 20 Susing the plot or the raw data answer the question. Answer: Check The provided Data.mat file contains the values of a function f(t) at values of t (also provided in the .mat file). The variable names are 'f' and 't' respectively. You are told that f(t) is a Fourier sine series with just four terms. This means that f(t) = a1 sin(27 vt) + a2 sin(27v2t) + az sin(27v3t) + a4 sin(21v4t) where a is the amplitude associated with the frequency Vi. Your task is to take the Fast Fourier Transform and plot the amplitude of the transform against the frequency. You will see 4 very sharp spikes coinciding with each of the 4 terms in f(t). What is the highest frequency of the four frequencies rounded to the nearest half integer (the maximum resolution for the frequency domain)? The following code will help you get started but is missing some important steps. 1 % This code will help you get started with finding frequencies and amplitudes of a Fourier series 2 3 load('Data.mat') Defines the function values f and the associated values of t 4 dt = t(2) - t(1); %The tvector has equally spaced t values so this is the separation between t values 5 6 N = length(t); 7 F = %%% take the fast fourier transform of f/N 8 Fshifted = 88% use the fftshift function to place the frequency in the centre 9 Fmag = %%% find the magnitude of the spectrum Fshifted 10 nu_Ny = %%% define the Nyquist frequency 11 nu = linspace(0,nu_Ny,N/2+1); $this is the spectrum of frequency values associated with the FFT frequencies 12 13 %finally we have to properly add the negative and positive frequencies together 14 F1 = Fmag (N/2+1:N); 15 F2 = Fmag (N/2:-1:1); 16 a = [F1,0] + [,F2]; 17 18 Splot the amplitudes a versus their associated frequencies 19 20 Susing the plot or the raw data answer the question. Answer: Check
Step by Step Solution
There are 3 Steps involved in it

Get step-by-step solutions from verified subject matter experts