

Question: MATLAB For the project, you will be analyzing the steady-state response of an RC circuit (R = 1 k? and C = 1 F). The
MATLAB
For the project, you will be analyzing the steady-state response of an RC circuit (R = 1 k? and C = 1 F). The input signal is a square wave with peak-to-peak amplitude of 2 and a frequency of 100 Hz (T=0.01s).
Write a MATLAB function called fourier analysis square which will take as inputs the amplitude, period, and the number of terms (excluding the DC term) used for the approximation of the input square wave signal. The output should be the coefficients (including the DC term) in exponential form, and the approximate signal (in the anonymous equation form). Using the function created, estimate the DC term and the first 50 terms of the square wave, as well as the approximation of the input signal. Plot the input signal the approximation signal. Make sure the plot has a grid on it. Provide proper axes labeling, legend, and title for the plot.
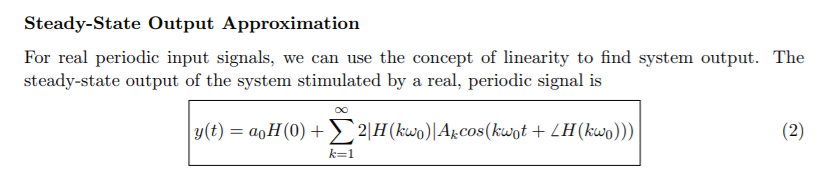
Steady-State Output Approximation For real periodic input signals, we can use the concept of linearity to find system output. The steady-state output of the system stimulated by a real, periodic signal is k=1 Steady-State Output Approximation For real periodic input signals, we can use the concept of linearity to find system output. The steady-state output of the system stimulated by a real, periodic signal is k=1
Step by Step Solution
There are 3 Steps involved in it

Get step-by-step solutions from verified subject matter experts