

Question: MATLAB Format Requirements: Make sure your m - file scripts are fully commented and organized. All plots must have labelled axes, a title, legend, font
MATLAB
Format Requirements: Make sure your mfile scripts are fully commented and organized. All plots must have labelled axes, a title, legend, font size line thickness and the grid lines must be activated.
Support Requirements: If you need help, visiting the TAs' or professor's office hours is highly recommended. If you cannot attend the scheduled office hours, the TAs and professor are also available by appointment. If you email questions, email the TAs first. If they cannot answer the question, your question will be escalated to the professor.
General Note: Many of the questions have builtin commands available in MATLAB or Octave to do these calculations automatically. You may NOT use these commands. The intent is for you to understand the logic of how your script must work to produce results. You will use the Excel file titled "ASE Numerical Analysis Assignment Data" to perform these calculations. There are multiple sheets that have different data sets for different questions. These data sets are all formatted differently. You may NOT change the formatting of the excel sheet. Your MATLAB code must account for the different formats of the data sets.
Question : Compute the probability of the sum of d dice ie What are the odds of rolling a etc. Plot the probability versus the sum total; this is the expected distribution of a random set of rolls. You will plot a histogram of the sum of rolls of d assuming you have rolled then then then then and finally rolls. In your code you should comment if each histogram has the expected distribution.
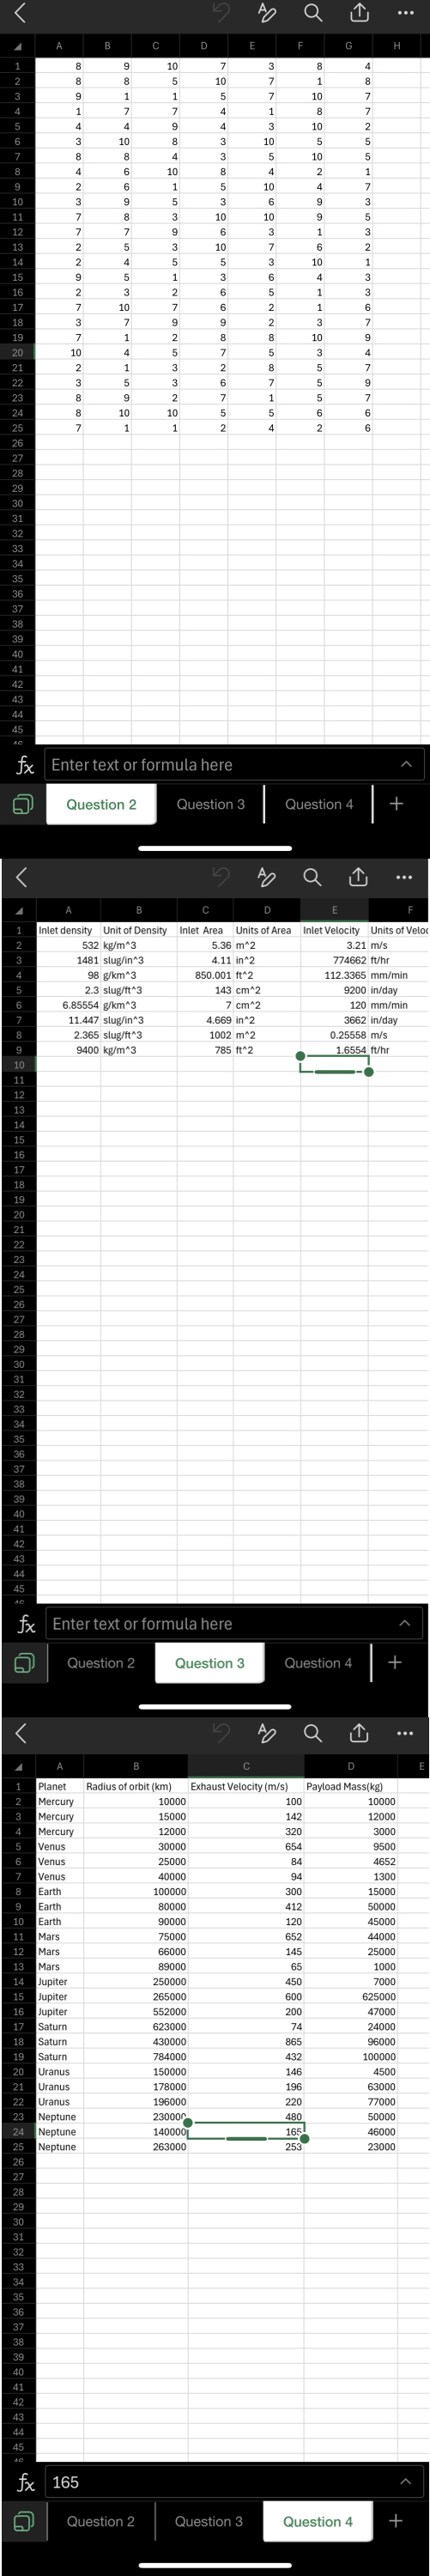
Question : Using the data from the sheet "Question calculate the mean of this data set. Determine what the median value is; this will require your code to order the data set.
You may NOT use any builtin sorting functions; your code must manually order the data set. Compute the standard deviation of this data set, you may NOT use the builtin standard deviation command. Finally compute the mode of the data set. The mode is defined as the value that appears the most. Example: if your data set is the mode is as it appears the most. If you have multiple values that appear the most, they are all the mode.
Question : From the continuity equation given in lecture ; assuming compressible flow density may change calculate the outlet velocity in miles per year given the data on the sheet "Question You must maintain proper significant figures; note that the units of your givens vary from calculation to calculation.
Question : Using the rocket equation from lecture and the orbital velocity visviva equation also from lecture calculate the initial mass of a rocket using the parameters given in the sheet "Question Assume that the orbit is perfectly circular ie variable a is equal to variable in the visviva equation You must retrieve the values for parameter the standard gravitational parameter from the NASA website hint: it is often referred to as GM You are assuming that your rocket is launching from the "surface" of the planet you wish to be orbiting. You do not have to account for significant figures.
Step by Step Solution
There are 3 Steps involved in it
1 Expert Approved Answer
Step: 1 Unlock

Question Has Been Solved by an Expert!
Get step-by-step solutions from verified subject matter experts
Step: 2 Unlock
Step: 3 Unlock