

Question: matlab Generate a scatter plot for columns 2 and 7 (these should already be selected at the top of this script). Label the x axis
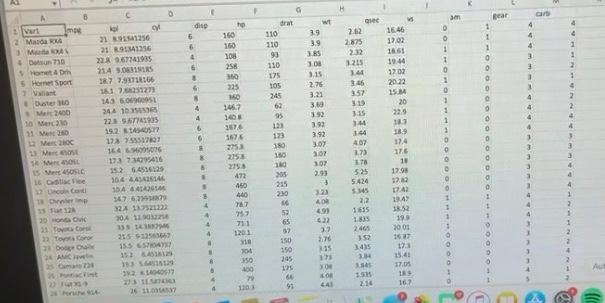
Generate a scatter plot for columns 2 and 7 (these should already be selected at the top of this script). Label the x axis "weight" and the y axis "mpg". Add the title "HP vs. Weight" to the plot. 43 44 % Place your plot code here 1 we disp WI 39 3.9 sec 202 2.875 4 4 16.46 17.02 1861 Bar 1 1 1 0 O 4 4 4 3 21 1256 21 91341356 229.6741935 214 3.0311 387 7.81716166 1 160 160 100 25 100 225 1 1 9 30 3.15 drat 110 110 93 110 175 SOS 245 63 95 125 14 E O 2 8 mo 2 Mata MU Den 716 Home 5 Home Sport 1 Want Dust Mar 2000 0 Men 2.16 1120 Men 200 2 MOSE MOL 15 e 40 16 2.75 6 5 4 4 TE USE TE 1702 2022 15.84 20 369 4 2 2 3 0 1 1 1 1467 14 2016 0 0 o 0 O 0 0 0 0 315 1.4 144 407 3 4 4 4 4 3 3 3 3 3.92 39 392 3.02 30 3.07 6 123 114 ESE 0 0 4 3 3 3 4 CZE 0 . 525 5424 180 180 305 215 2.30 10 17.98 12.02 145 59 344 10 1536 223 5.5774935 152 ASOSTI 123 *5551701 14 HOST 173 7395416 152 54516129 164 444 14 44100 347 6.1979 2A 137521222 304 135 TL 215 515033 155 60 15312 13 12 LOS 0 0 D O 472 460 440 787 257 23 1 1 1 1 TO 151 20 OC 16 2,2 11555 1335 4 4 1 4 4 1943 352 190 30.01 16 175 15. 27 2.76 15 251 53 65 97 150 150 245 125 66 91 3 Toyota Dooge ANCH 2 E 8 OSE 2 100 0 10 1 44 2.14 162 11 1303
Step by Step Solution
There are 3 Steps involved in it

Get step-by-step solutions from verified subject matter experts