

Question: matlab help!!!! 02. Write a code that plots the above function 3 times in the same plot and figure. In the first plot, use the


matlab help!!!!
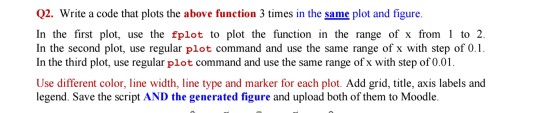
02. Write a code that plots the above function 3 times in the same plot and figure. In the first plot, use the fplot to plot the function in the range of x from to2 In the second plot, use regular plot command and use the same range of x with step of 0.1. In the third plot, use regular plot command and use the same range of x with step of 0.01 Use different color, line width, line type and marker for each plot. Add grid, title, axis labels and legend. Save the script AND the generated figure and upload both of them to Moodle
Step by Step Solution
There are 3 Steps involved in it
1 Expert Approved Answer
Step: 1 Unlock

Question Has Been Solved by an Expert!
Get step-by-step solutions from verified subject matter experts
Step: 2 Unlock
Step: 3 Unlock