

Question: matlab help please Q4. Write a code that plots the discrete measurement data of temperature (F) and wind speed (MPH) and Relative Humidity (%) versus
matlab help please Q4. Write a code that plots the discrete measurement data of temperature (F) and wind speed (MPH) and Relative Humidity (%) versus the time using an array of 3 by 1 plots in one figure as indicated below. Time (24 hr) 7 8 9 10 11 12 13 14 15 16 17 18 19 20 21 22 Temp (F) 64 66 66 71 74 76 78 79 79 79 78 76 74 70 66 64 wind speed (MPH) 11 9 8 6.5 6 5 4 5.5 5 4 3 4 5.5 6 6.5 7 Relative Humidity (%) 58 56 54 50 44 40 33 26 24 22 22 26 30 34 36 40 In the first subplot, plot the three variables using different marker type and color.
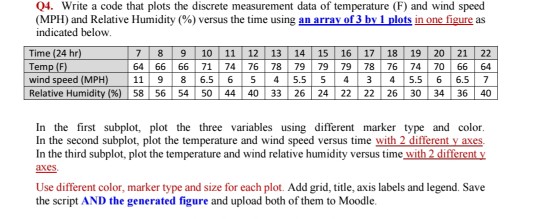
In the second subplot, plot the temperature and wind speed versus time with 2 different y axes. In the third subplot, plot the temperature and wind relative humidity versus time with 2 different y axes. Use different color, marker type and size for each plot. Add grid, title, axis labels and legend. Save the script. and figures
matlab help please
Q4. Write a code that plots the discrete measurement data of temperature (F) and wind speed ( MPH) and Relative Humidity (%) versus the time using an arrayof3 indicated below. rLlots in one igure as 7 8 9 10 11 12 13 14 15 16 17 18 19 20 21 22 64 66 66 71 74 76 78 79 79 79 78 76 74 70 66 64 -windspeed(MPH) 111191816.51 61514155| 51413141551616517 | Relative Humidity (%) . 58 | 56-54 | 50-44-40 | 33-26 24 | 22 | 22 | 26 | 30-34 36 40 Time (24 hr) Temp(F In the first subplot, plot the three variables using different marker type and color In the second subplot, plot the temperature and wind speed versus time with 2 different y axes In the third subplot, plot the temperature and wind relative humidity versus time with 2 different axes. Use different color, marker type and size for each plot. Add grid, title, axis labels and legend. Save the script AND the generated figure and upload both of them to Moodle
Step by Step Solution
There are 3 Steps involved in it

Get step-by-step solutions from verified subject matter experts