

Question: Matlab help Show matlab scripts and plots for parts a,b, c Thanks % start stepsize stop t=linspace(0,2*pi(),100); y = sin(t); plot(t, y); title('Demo of Simple
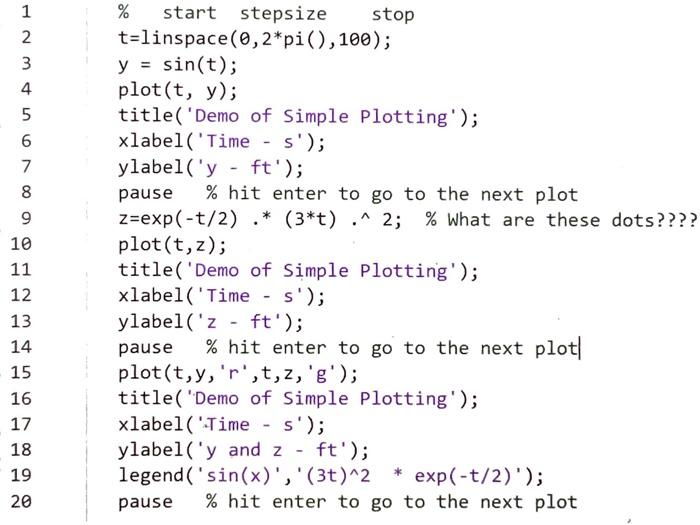
% start stepsize stop
t=linspace(0,2*pi(),100);
y = sin(t);
plot(t, y);
title('Demo of Simple Plotting');
xlabel('Time - s');
ylabel('y - ft');
pause % hit enter to go to the next plot
z=exp(-t/2) .* (3*t) .^ 2; % What are these dots????
plot(t,z);
title('Demo of Simple Plotting');
xlabel('Time - s');
ylabel('z - ft');
pause % hit enter to go to the next plot
plot(t,y,'r',t,z,'g');
title('Demo of Simple Plotting');
xlabel('Time - s');
ylabel('y and z - ft');
legend('sin(x)','(3t)^2 * exp(-t/2)');
pause % hit enter to go to the next plot
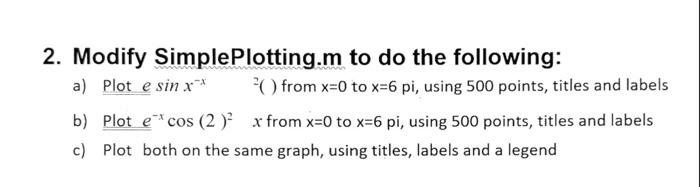
2. Modify SimplePlotting.m to do the following: a) Plot esinxx 2 ( ) from x=0 to x=6 pi, using 500 points, titles and labels b) Plot excos(2)2x from x=0 to x=6pi, using 500 points, titles and labels c) Plot both on the same graph, using titles, labels and a legend
Step by Step Solution
There are 3 Steps involved in it

Get step-by-step solutions from verified subject matter experts