

Question: Matlab help... this is what ive got so far.. not sure how to plot in an interval for this 5. (20 points) Write a Matlab
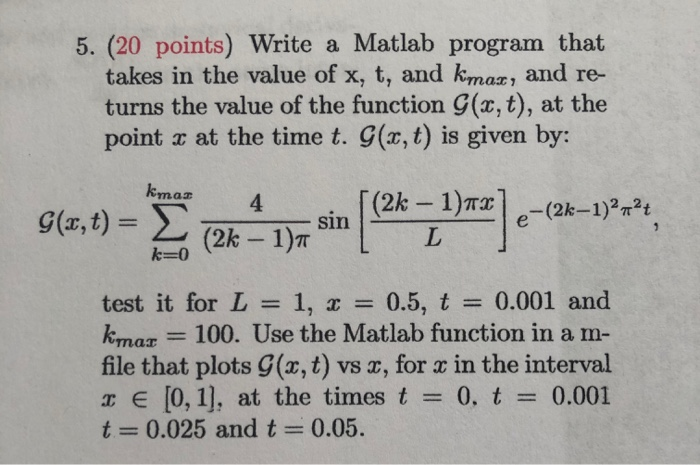
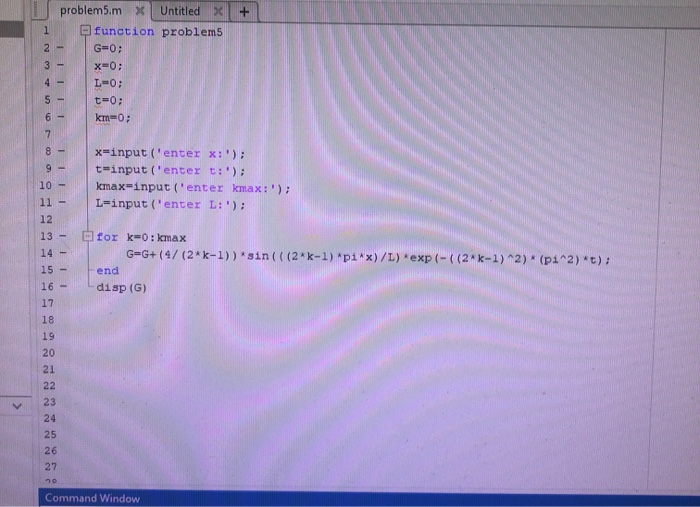
5. (20 points) Write a Matlab program that takes in the value of x, t, and kmaz, and re- turns the value of the function G(x, t), at the point x at the time t. G(x, t) is given by: kmas G(x,t) = 2 4 cin(2k 1) x)-(2k-1)-24 (2k-1)7 sin L ] test it for L = 1, 1 = 0.5, t = 0.001 and kmar = 100. Use the Matlab function in a m- file that plots G(x, t) vs x, for x in the interval xe [0, 1], at the times t = 0. t = 0.001 t=0.025 and t = 0.05. + 1 problems. m x Untitled x Q function problem G=0; x=0; L-0; t=0; km=0; 1 1 1 1 1 1 x=input('enter x:'); t=input('enter t:'); kmax=input('enter kmax:'); L=input('enter L:'); 1 for k=1: kmax G=G+(4/(2*k-1)) sin(((2k-1) pix)/L) *exp(-((2k-1)^2) * (p1^2) *t); end disp (G) la 15 - 27 Command Window
Step by Step Solution
There are 3 Steps involved in it

Get step-by-step solutions from verified subject matter experts