

Question: MATLAB homework, please help with (b) and (c). Thank you! This is the contour map I got: (a) Copy the following into your script: [X,
MATLAB homework, please help with (b) and (c). Thank you!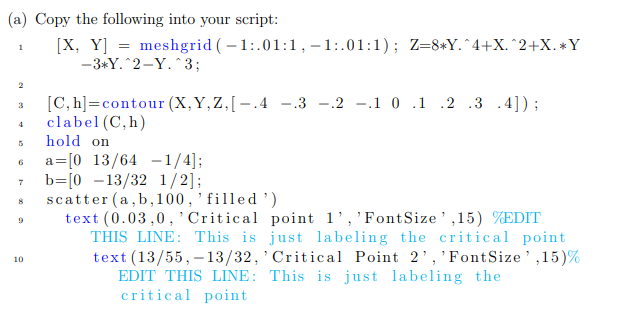
This is the contour map I got:
![[X, Y] meshgrid (-1.01:1, -1:.01:1); Z=8*Y.^4+X. ^2+X. *Y -3*Y.^2-Y. 3: 1 4](https://dsd5zvtm8ll6.cloudfront.net/si.experts.images/questions/2024/10/671626cb7b95c_971671626cb1b3b3.jpg)
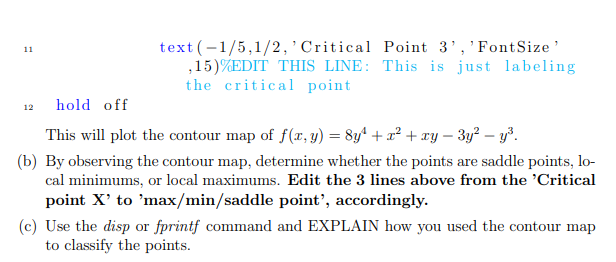
(a) Copy the following into your script: [X, Y] meshgrid (-1.01:1, -1:.01:1); Z=8*Y.^4+X. ^2+X. *Y -3*Y.^2-Y. 3: 1 4 7 [C, h]=contour (X,Y,Z, [ -.4 -3 -2 -.1 0.1 .2 .3 .4]); clabel (C,h) hold on a=[0 13/64 -1/4]; b=[0 13/32 1/2]; scatter(a, b, 100, 'filled') text (0.03,0, 'Critical point l', 'Font Size',15) %EDIT THIS LINE: This is just labeling the critical point text (13/55, -13/32, 'Critical Point 2', 'FontSize',15)% EDIT THIS LINE: This is just labeling the critical point 9 10 11 12 text(-1/5,1/2, 'Critical Point 3', 'Font Size ,15)%EDIT THIS LINE: This just labeling the critical point hold off This will plot the contour map of f(x, y) = 8y4 +2+ xy 3y y?. (b) By observing the contour map, determine whether the points are saddle points, lo- cal minimums, or local maximums. Edit the 3 lines above from the 'Critical point X' to 'max/min/saddle point', accordingly. (c) Use the disp or fprintf command and EXPLAIN how you used the contour map to classify the points. 1 0.8 0.0.3 0.4 81 -0.20. 1 81 0.9.3 0.4 0.6 -0.3 Critical Point 3 0.4 -0.1 -0.2 80 -0.2 -0.1 0.2 0.1 0 0 Griticat point 1 003 -0.2 0.4 -0.4 Crtical Point 2 0.23A -0.6 0.9 8.1 0.86934 -0.8 -1 -1 -0.8 -0.6 -0.4 -0.2 0 0.2 0.4 0.6 0.8 1 (a) Copy the following into your script: [X, Y] meshgrid (-1.01:1, -1:.01:1); Z=8*Y.^4+X. ^2+X. *Y -3*Y.^2-Y. 3: 1 4 7 [C, h]=contour (X,Y,Z, [ -.4 -3 -2 -.1 0.1 .2 .3 .4]); clabel (C,h) hold on a=[0 13/64 -1/4]; b=[0 13/32 1/2]; scatter(a, b, 100, 'filled') text (0.03,0, 'Critical point l', 'Font Size',15) %EDIT THIS LINE: This is just labeling the critical point text (13/55, -13/32, 'Critical Point 2', 'FontSize',15)% EDIT THIS LINE: This is just labeling the critical point 9 10 11 12 text(-1/5,1/2, 'Critical Point 3', 'Font Size ,15)%EDIT THIS LINE: This just labeling the critical point hold off This will plot the contour map of f(x, y) = 8y4 +2+ xy 3y y?. (b) By observing the contour map, determine whether the points are saddle points, lo- cal minimums, or local maximums. Edit the 3 lines above from the 'Critical point X' to 'max/min/saddle point', accordingly. (c) Use the disp or fprintf command and EXPLAIN how you used the contour map to classify the points. 1 0.8 0.0.3 0.4 81 -0.20. 1 81 0.9.3 0.4 0.6 -0.3 Critical Point 3 0.4 -0.1 -0.2 80 -0.2 -0.1 0.2 0.1 0 0 Griticat point 1 003 -0.2 0.4 -0.4 Crtical Point 2 0.23A -0.6 0.9 8.1 0.86934 -0.8 -1 -1 -0.8 -0.6 -0.4 -0.2 0 0.2 0.4 0.6 0.8 1
Step by Step Solution
There are 3 Steps involved in it

Get step-by-step solutions from verified subject matter experts