

Question: matlab i want code for eash Task 1 Plot x versus y for y=1+sin(x/5). Let x vary from 0 to 2.5 in increments of 0.12.
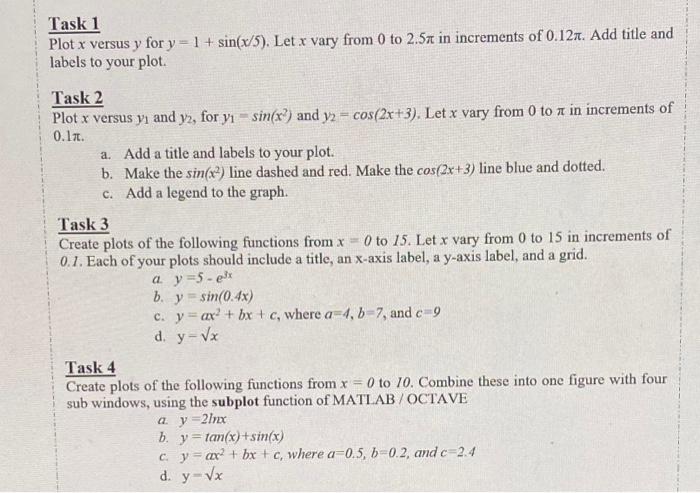
Task 1 Plot x versus y for y=1+sin(x/5). Let x vary from 0 to 2.5 in increments of 0.12. Add title and labels to your plot. Task 2 Plot x versus y1 and y2, for y1=sin(x2) and y2=cos(2x+3), Let x vary from 0 to in increments of 0.1. a. Add a title and labels to your plot. b. Make the sin(x2) line dashed and red. Make the cos(2x+3) line blue and dotted. c. Add a legend to the graph. Task 3 Create plots of the following functions from x=0 to 15. Let x vary from 0 to 15 in increments of 0.1. Each of your plots should include a title, an x-axis label, a y-axis label, and a grid. a y=5e3x b. y=sin(0.4x) c. y=ax2+bx+c, where a=4,b=7, and c=9 d. y=x Task 4 Create plots of the following functions from x=0 to 10 . Combine these into one figure with four sub windows, using the subplot function of MATLAB / OCTAVE a. y=2lnx b. y=tan(x)+sin(x) c. y=ax2+bx+c, where a=0.5,b=0.2, and c=2.4 d. y=x
Step by Step Solution
There are 3 Steps involved in it

Get step-by-step solutions from verified subject matter experts