

Question: MATLAB II. Use a for loop to plot the function given below over the interval 5x20. Properly label the plot. The variable y represents height
MATLAB 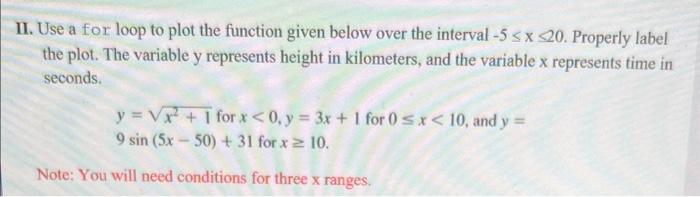
II. Use a for loop to plot the function given below over the interval 5x20. Properly label the plot. The variable y represents height in kilometers, and the variable x represents time in seconds. y=x2+1forx
Step by Step Solution
There are 3 Steps involved in it
1 Expert Approved Answer
Step: 1 Unlock

Question Has Been Solved by an Expert!
Get step-by-step solutions from verified subject matter experts
Step: 2 Unlock
Step: 3 Unlock