

Question: MATLAB language: Create a user-function without output argument that displays the required graph. The user will enter inlet data when using the function. The user
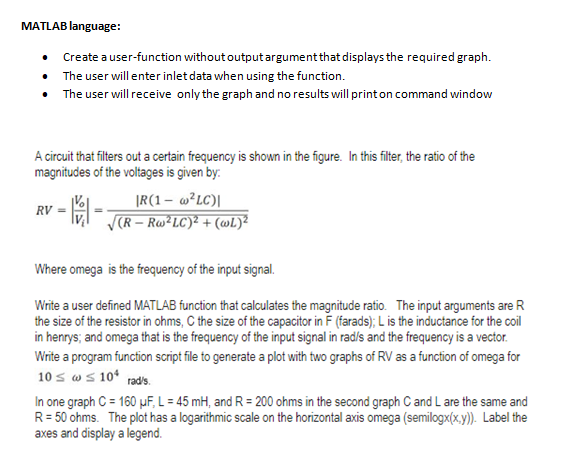
MATLAB language: Create a user-function without output argument that displays the required graph. The user will enter inlet data when using the function. The user will receive only the graph and no results will print on command window A circuit that filters out a certain frequency is shown in the figure. In this filter, the ratio of the magnitudes of the voltages is given by: |R(1 - w2LC) (R - RwLC)2 + (WL)2 Where omega is the frequency of the input signal. Write a user defined MATLAB function that calculates the magnitude ratio. The input arguments are R the size of the resistor in ohms, C the size of the capacitor in F (farads); L is the inductance for the coil in henrys, and omega that is the frequency of the input signal in rad/s and the frequency is a vector Write a program function script file to generate a plot with two graphs of RV as a function of omega for 10 S W s 10* rad's In one graph C = 160 MF, L = 45 mH, and R = 200 ohms in the second graph C and L are the same and R = 50 ohms. The plot has a logarithmic scale on the horizontal axis omega (semilogx(x,y)). Label the axes and display a legend
Step by Step Solution
There are 3 Steps involved in it

Get step-by-step solutions from verified subject matter experts