

Question: *MATLAB * need help please with these two questions please A contagious disease is spread via contact between people in a community. We can model
*MATLAB *
need help please with these two questions please
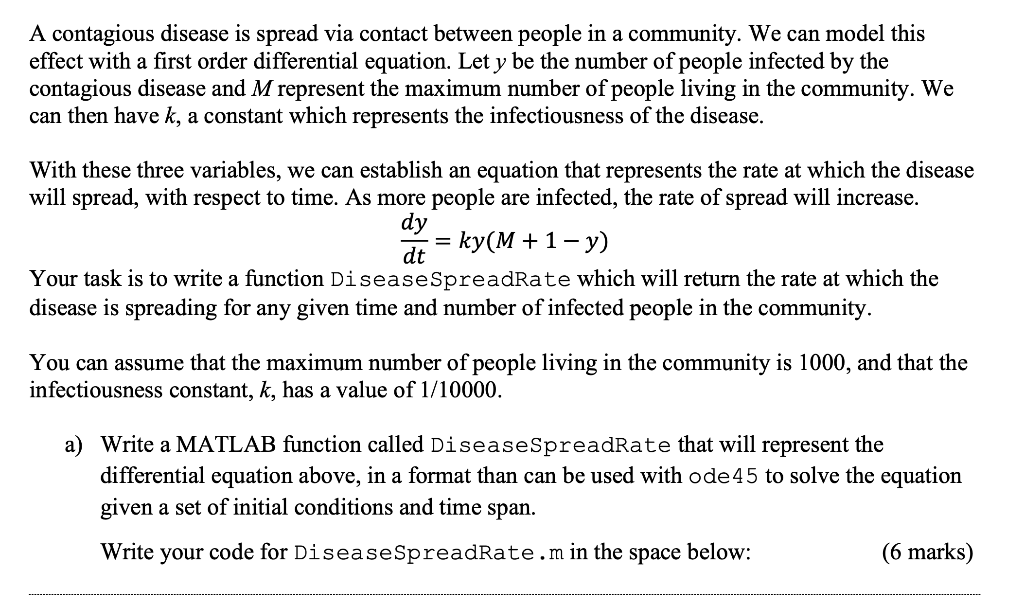
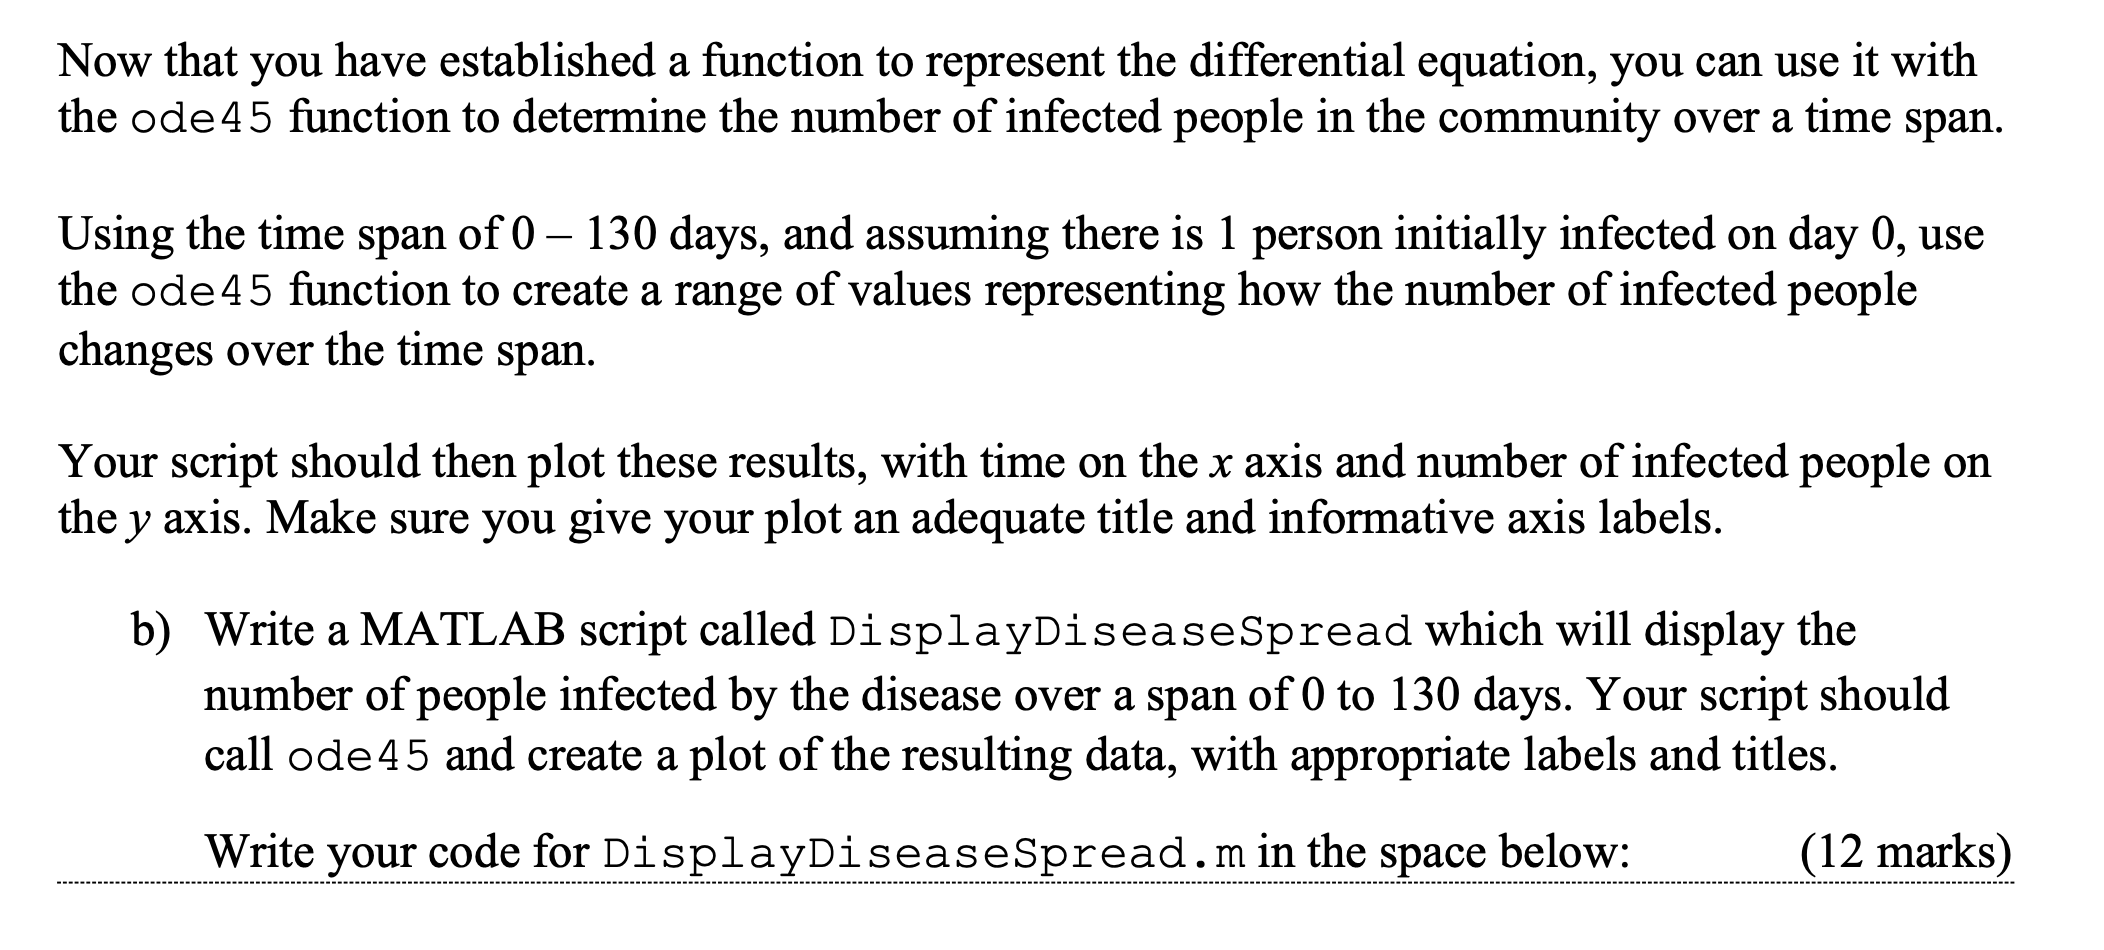
A contagious disease is spread via contact between people in a community. We can model this effect with a first order differential equation. Let y be the number of people infected by the contagious disease and M represent the maximum number of people living in the community. We can then have k, a constant which represents the infectiousness of the disease. With these three variables, we can establish an equation that represents the rate at which the disease will spread, with respect to time. As more people are infected, the rate of spread will increase. dy ky(M +1-y) dt Your task is to write a function DiseaseSpreadRate which will return the rate at which the disease is spreading for any given time and number of infected people in the community. You can assume that the maximum number of people living in the community is 1000, and that the infectiousness constant, k, has a value of 1/10000. a) Write a MATLAB function called DiseaseSpreadRate that will represent the differential equation above, in a format than can be used with ode45 to solve the equation given a set of initial conditions and time span. Write your code for DiseaseSpreadRate.m in the space below: (6 marks) Now that you have established a function to represent the differential equation, you can use it with the ode45 function to determine the number of infected people in the community over a time span. Using the time span of 0 - 130 days, and assuming there is 1 person initially infected on day 0, use the ode 45 function to create a range of values representing how the number of infected people changes over the time span. Your script should then plot these results, with time on the x axis and number of infected people on the y axis. Make sure you give your plot an adequate title and informative axis labels. b) Write a MATLAB script called DisplayDiseaseSpread which will display the number of people infected by the disease over a span of 0 to 130 days. Your script should call ode 45 and create a plot of the resulting data, with appropriate labels and titles. Write your code for DisplayDiseaseSpread.m in the space below: (12 marks) A contagious disease is spread via contact between people in a community. We can model this effect with a first order differential equation. Let y be the number of people infected by the contagious disease and M represent the maximum number of people living in the community. We can then have k, a constant which represents the infectiousness of the disease. With these three variables, we can establish an equation that represents the rate at which the disease will spread, with respect to time. As more people are infected, the rate of spread will increase. dy ky(M +1-y) dt Your task is to write a function DiseaseSpreadRate which will return the rate at which the disease is spreading for any given time and number of infected people in the community. You can assume that the maximum number of people living in the community is 1000, and that the infectiousness constant, k, has a value of 1/10000. a) Write a MATLAB function called DiseaseSpreadRate that will represent the differential equation above, in a format than can be used with ode45 to solve the equation given a set of initial conditions and time span. Write your code for DiseaseSpreadRate.m in the space below: (6 marks) Now that you have established a function to represent the differential equation, you can use it with the ode45 function to determine the number of infected people in the community over a time span. Using the time span of 0 - 130 days, and assuming there is 1 person initially infected on day 0, use the ode 45 function to create a range of values representing how the number of infected people changes over the time span. Your script should then plot these results, with time on the x axis and number of infected people on the y axis. Make sure you give your plot an adequate title and informative axis labels. b) Write a MATLAB script called DisplayDiseaseSpread which will display the number of people infected by the disease over a span of 0 to 130 days. Your script should call ode 45 and create a plot of the resulting data, with appropriate labels and titles. Write your code for DisplayDiseaseSpread.m in the space below: (12 marks)
Step by Step Solution
There are 3 Steps involved in it

Get step-by-step solutions from verified subject matter experts