

Question: MATLAB ONLY MATLAB ONLY MATLAB ONLY MATLAB ONLY MATLAB ONLY MATLAB ONLY MATLAB ONLY MATLAB ONLY MATLAB ONLY MATLAB ONLY MATLAB ONLY MATLAB ONLY MATLAB
MATLAB ONLY MATLAB ONLY MATLAB ONLY MATLAB ONLY MATLAB ONLY MATLAB ONLY MATLAB ONLY MATLAB ONLY MATLAB ONLY MATLAB ONLY MATLAB ONLY MATLAB ONLY MATLAB ONLY MATLAB ONLY MATLAB ONLY MATLAB ONLY MATLAB ONLY MATLAB ONLY MATLAB ONLY MATLAB ONLY MATLAB ONLY MATLAB ONLY MATLAB ONLY MATLAB ONLY MATLAB ONLY MATLAB ONLY MATLAB ONLY MATLAB ONLY MATLAB ONLY MATLAB ONLY MATLAB ONLY MATLAB ONLY MATLAB ONLY MATLAB ONLY MATLAB ONLY MATLAB ONLY MATLAB ONLY MATLAB ONLY MATLAB ONLY MATLAB ONLY MATLAB ONLY MATLAB ONLY MATLAB ONLY MATLAB ONLY MATLAB ONLY MATLAB ONLY MATLAB ONLY MATLAB ONLY
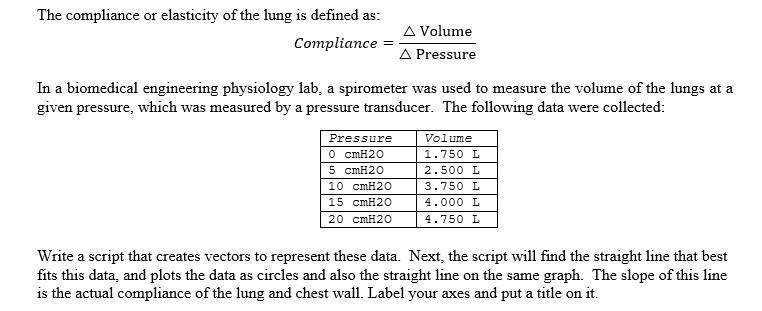
The compliance or elasticity of the lung is defined as: A Volume Compliance = A Pressure In a biomedical engineering physiology lab, a spirometer was used to measure the volume of the lungs at a given pressure, which was measured by a pressure transducer. The following data were collected: Pressure 0 cmH2O 5 cmH20 10 cmH2O 15 cmH20 20 cmH20 Volume 1.750 L 2.500 L 3.750 L 4.000 L 4.750 L Write a script that creates vectors to represent these data. Next, the script will find the straight line that best fits this data, and plots the data as circles and also the straight line on the same graph. The slope of this line is the actual compliance of the lung and chest wall. Label your axes and put a title on it
Step by Step Solution
There are 3 Steps involved in it

Get step-by-step solutions from verified subject matter experts