

Question: matlab or python Problem #3 A specimen is placed in an axial-load test machine. The applied tensile force F on the specimen leads to the
 matlab or python
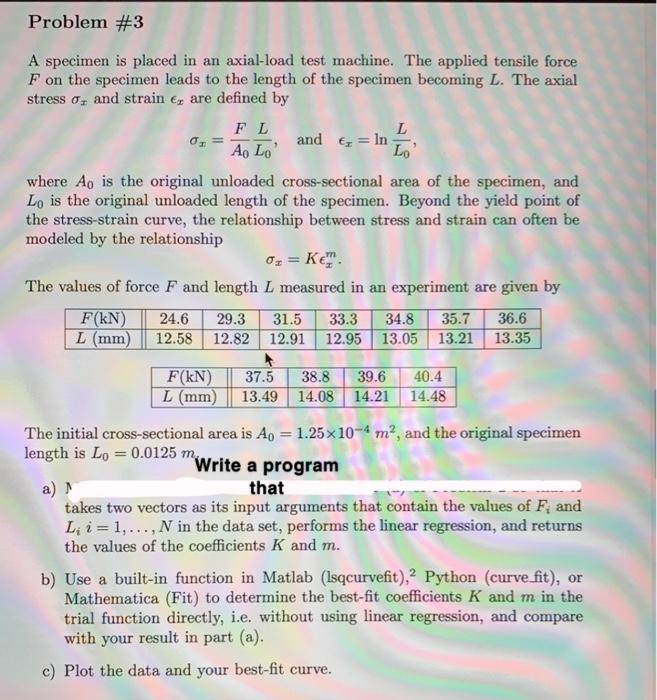
Problem #3 A specimen is placed in an axial-load test machine. The applied tensile force F on the specimen leads to the length of the specimen becoming L. The axial stress o, and strain are defined by FL L 0. and ez = In Ao Lol Lo where Ao is the original unloaded cross-sectional area of the specimen, and Lo is the original unloaded length of the specimen. Beyond the yield point of the stress-strain curve, the relationship between stress and strain can often be modeled by the relationship 0x = K. The values of force F and length L measured in an experiment are given by F(kN) 24.6 29.3 31.5 33.3 34.8 35.7 36.6 L (mm) 12.58 12.82 12.91 12.95 13.05 13.21 13.35 F(kN) L (mm) 37.5 13.49 38.8 14.08 39.6 14.21 40.4 14.48 The initial cross-sectional area is A0 = 1.25x10⁻⁴ m, and the original specimen length is Lo = 0.0125 m Write a program a) that takes two vectors as its input arguments that contain the values of F, and Lii= 1,..., N in the data set, performs the linear regression, and returns the values of the coefficients K and m. b) Use a built-in function in Matlab (Isqcurvefit),? Python (curve fit), or Mathematica (Fit) to determine the best-fit coefficients K and m in the trial function directly, i.e. without using linear regression, and compare with your result in part (a). c) Plot the data and your best-fit curve
Step by Step Solution
There are 3 Steps involved in it

Get step-by-step solutions from verified subject matter experts