Question: Matlab Part 1: Put Milgram's data into MATLAB Write a script named pjla .m which constructs a data set consistent with Milgram's data as given
Matlab
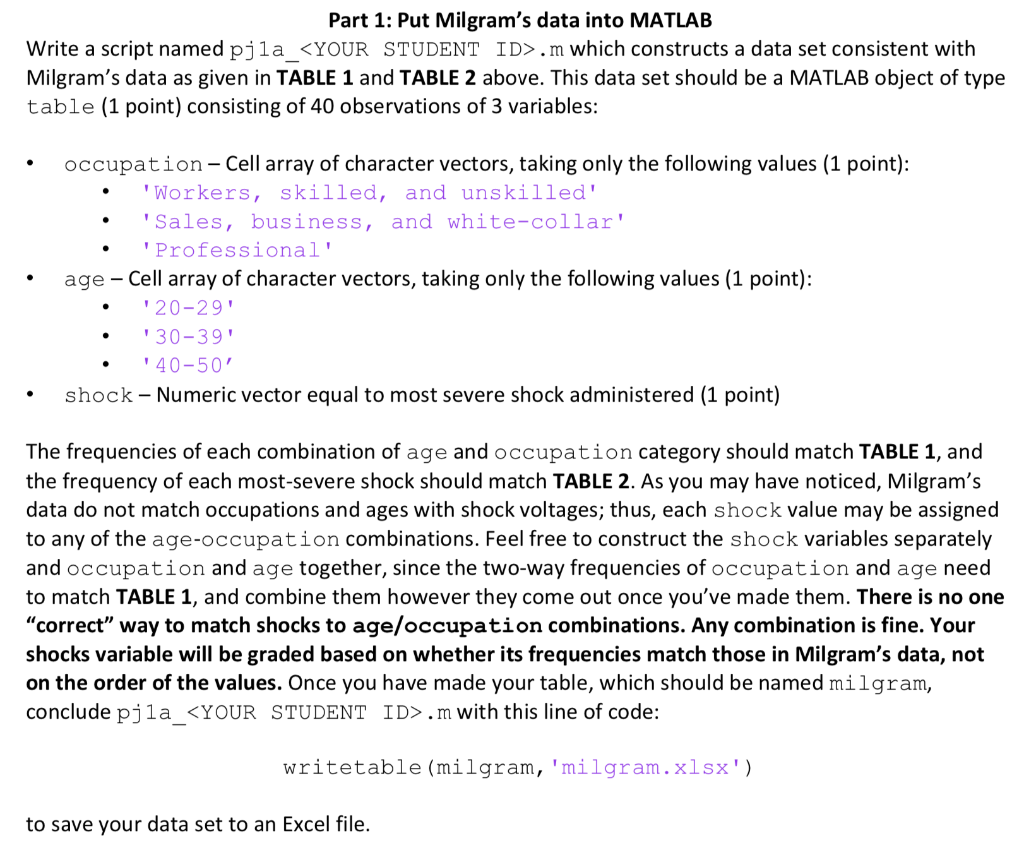
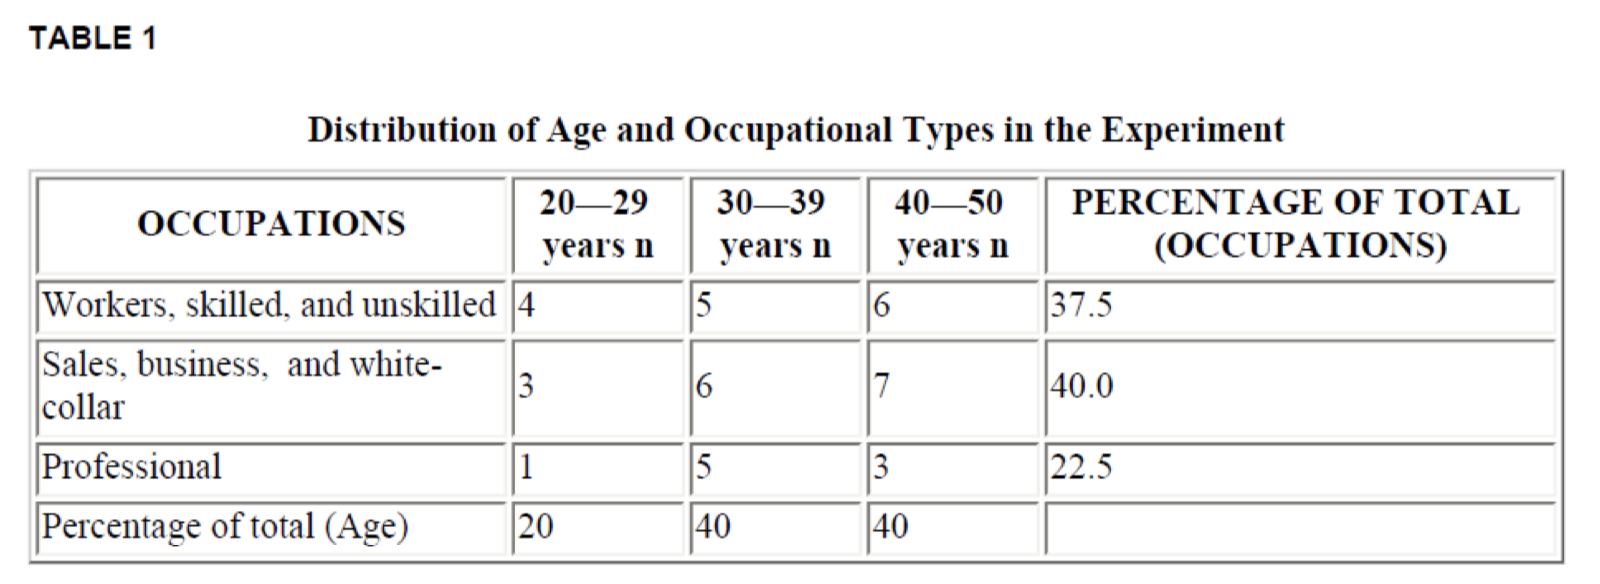
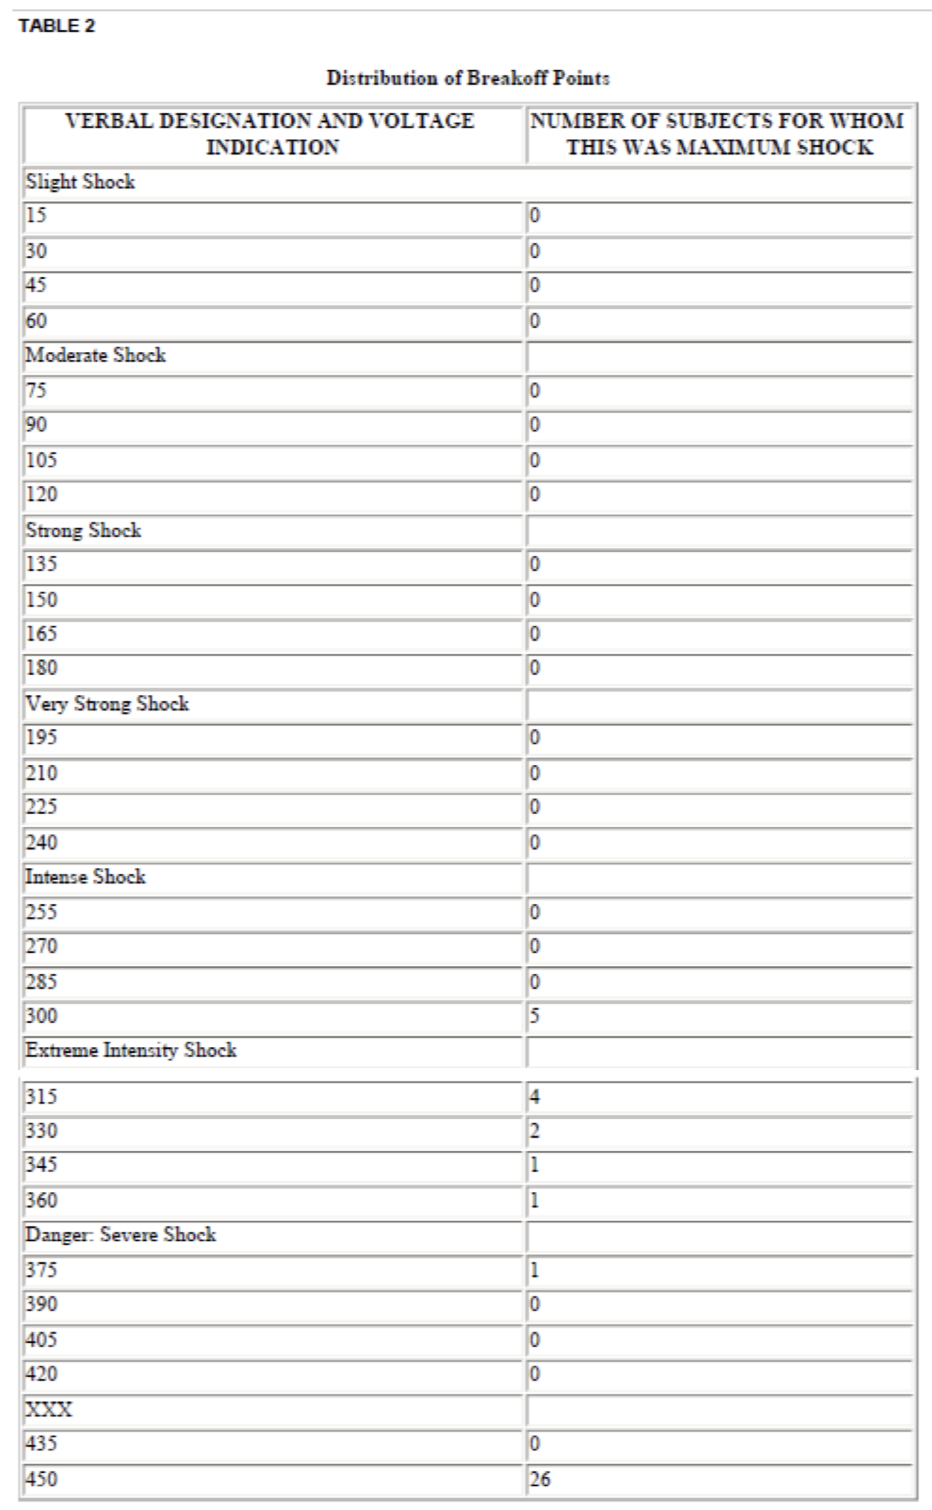
Part 1: Put Milgram's data into MATLAB Write a script named pjla .m which constructs a data set consistent with Milgram's data as given in TABLE 1 and TABLE 2 above. This data set should be a MATLAB object of type table (1 point) consisting of 40 observations of 3 variables: occupation-Cell array of character vectors, taking only the following values (1 point): 'Workers, skilled, and unskilled' 'Sales, business, and white-collar' 'Professional' age - Cell array of character vectors, taking only the following values (1 point): '20-29 '30-39' '40-50 shock - Numeric vector equal to most severe shock administered (1 point) The frequencies of each combination of age and occupation category should match TABLE 1, and the frequency of each most-severe shock should match TABLE 2. As you may have noticed, Milgram's data do not match occupations and ages with shock voltages; thus, each shock value may be assigned to any of the age-occupation combinations. Feel free to construct the shock variables separately and occupation and age together, since the two-way frequencies of occupation and age need to match TABLE 1, and combine them however they come out once you've made them. There is no one "correct" way to match shocks to age/occupation combinations. Any combination is fine. Your shocks variable will be graded based on whether its frequencies match those in Milgram's data, not on the order of the values. Once you have made your table, which should be named milgram, conclude pjla .m with this line of code: writetable (milgram, 'milgram.xlsx') to save your data set to an Excel file. TABLE 1 37.5 Distribution of Age and Occupational Types in the Experiment 2029 3039 4050 PERCENTAGE OF TOTAL OCCUPATIONS years n | years n years n (OCCUPATIONS) Workers, skilled, and unskilled 4 Sales, business, and white- 40.0 collar Professional 5. 3 Percentage of total (Age) 22.5 TABLE 2 Distribution of Breakoff Points VERBAL DESIGNATION AND VOLTAGE INDICATION Slight Shock NUMBER OF SUBJECTS FOR WHOM THIS WAS MAXIMUM SHOCK Moderate Shock 90 105 120 Strong Shock 135 150 165 180 Very Strong Shock 195 210 225 240 Intense Shock 255 270 285 300 Extreme Intensity Shock 315 330 345 360 Danger: Severe Shock 375 390 405 420 435 450 Part 1: Put Milgram's data into MATLAB Write a script named pjla .m which constructs a data set consistent with Milgram's data as given in TABLE 1 and TABLE 2 above. This data set should be a MATLAB object of type table (1 point) consisting of 40 observations of 3 variables: occupation-Cell array of character vectors, taking only the following values (1 point): 'Workers, skilled, and unskilled' 'Sales, business, and white-collar' 'Professional' age - Cell array of character vectors, taking only the following values (1 point): '20-29 '30-39' '40-50 shock - Numeric vector equal to most severe shock administered (1 point) The frequencies of each combination of age and occupation category should match TABLE 1, and the frequency of each most-severe shock should match TABLE 2. As you may have noticed, Milgram's data do not match occupations and ages with shock voltages; thus, each shock value may be assigned to any of the age-occupation combinations. Feel free to construct the shock variables separately and occupation and age together, since the two-way frequencies of occupation and age need to match TABLE 1, and combine them however they come out once you've made them. There is no one "correct" way to match shocks to age/occupation combinations. Any combination is fine. Your shocks variable will be graded based on whether its frequencies match those in Milgram's data, not on the order of the values. Once you have made your table, which should be named milgram, conclude pjla .m with this line of code: writetable (milgram, 'milgram.xlsx') to save your data set to an Excel file. TABLE 1 37.5 Distribution of Age and Occupational Types in the Experiment 2029 3039 4050 PERCENTAGE OF TOTAL OCCUPATIONS years n | years n years n (OCCUPATIONS) Workers, skilled, and unskilled 4 Sales, business, and white- 40.0 collar Professional 5. 3 Percentage of total (Age) 22.5 TABLE 2 Distribution of Breakoff Points VERBAL DESIGNATION AND VOLTAGE INDICATION Slight Shock NUMBER OF SUBJECTS FOR WHOM THIS WAS MAXIMUM SHOCK Moderate Shock 90 105 120 Strong Shock 135 150 165 180 Very Strong Shock 195 210 225 240 Intense Shock 255 270 285 300 Extreme Intensity Shock 315 330 345 360 Danger: Severe Shock 375 390 405 420 435 450


