

Question: Matlab Please answer both Problem 3 0 solutions submitted (max: 1) Chick-fil-A has created a new method of letting their customers know that they appreciate
 Please answer both
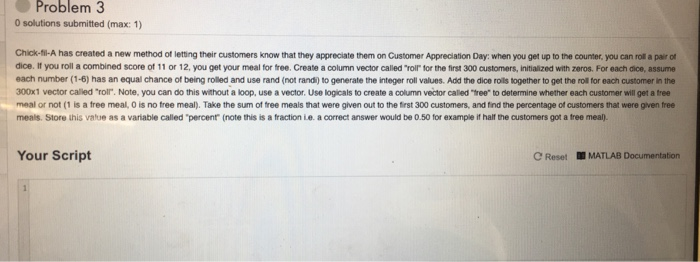
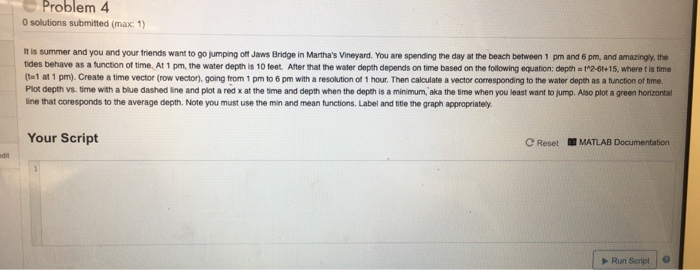
 Problem 3 0 solutions submitted (max: 1) Chick-fil-A has created a new method of letting their customers know that they appreciate them on Customer Appreciation Day: when you get up to the counter, you can roil a pair of dice. If you roill a combined score of 11 or 12, you get your meal for free. Create a column vector called "roll for the first 300 customers, initialized with zeros. For each dice, assume each number (1-6) has an equal chance of being rolled and use rand (not randi) to generate the integer roll values. Add the dice roils together to get the roll for each customer in the 300x1 vector called "roir. Note, you can do this without a loop, use a vector. Use logicals to create a column vector called "tree" to determine whether each customer will get a tree meal or not (1 is a free meal, O is no free meal). Take the sum of free meals that were given out to the first 300 customers, and find the percentage of customers that were given free meals. Store this value as a variable called percent (note this is a fraction Le. a correct answer would be 0.50 for example if half the customers got a tree meal). Your Script C Reset MATLAB Documentation Problem 4 0 solutions submitted (max: 1) t is summer and you and your triends want to go umping off Jaws Bridge in Martha's Vineyard. You are spending the day at the beach between 1 pm and 6 pm, and amazingy, the tides behave as a tunction of time At 1 pm, the water depth is 10 feet. After that the water depth depends on time based on the folowing equation: depth a t12-6t+15, where t is time (te1 at 1 pm). Create a time vector (row vector), going from 1 pm to 6 pm with a resolution of 1 hour. T Plot depth vs. time with a blue dashed line and plot a red x at the time and depth when the depth is a minimum, aka the time when you least want to jump. Also plot a green hortizontal ine that coresponds to the average depth. Note you must use the min and mean functions. Label and btle the graph appropriatey Your Script MATLAB Documentation Reset Run Script |
Step by Step Solution
There are 3 Steps involved in it

Get step-by-step solutions from verified subject matter experts