

Question: MATLAB PLEASE Exercise A surface plot of the equation f1(x; y) = 10 sinc( p x2 + y2); (1) where sinc(x) = sin(x) x is
MATLAB PLEASE
Exercise A surface plot of the equation f1(x; y) = 10 sinc( p x2 + y2); (1) where sinc(x) = sin(x) x is the normalized sinc function, looks a bit like the surface of a pool of water after a stone has been dropped in it, while the following equation f2(x; y) = 18 3 p x2 + y2 +sin( p x2 + y2)+ p 200 (x2 + y2) + 10 sin(x) + 10 sin(y) 1000 (2) produces a surface that looks like a ower. Figure 1 shows the mesh plots of these 2 surfaces. (a) f1(x; y) (b) f2(x; y) Figure 1: Surface plots for (a) f1(x; y) from equation (1) and (b) f2(x; y) from equation (2), both with numerically and symbolically evaluated integral values printed on them. The various tasks in this assignment include: a) (30 points) First, you have to plot the 2 functions. Use xmin and ymin values of -8 and xmax and ymax values of +8, and construct arrays for the x and y values using linspace vectors xs and ys with 201 points. From these, generate X and Y from meshgrid(xs,ys). You then compute the z-values for functions f1(x; y) and f2(x; y) in the arrays Z1 and Z2 using a vectorized calculation based on the expressions in equations (1) and (2) using X and Y. When you plot the surfaces, x the displyed z-values to be within the range zmin = 20 and zmax = +20 using axis. Do this for all the gures you display in this assignment. Plot the 2 functions, given by (X,Y,Z1) and (X,Y,Z2) using mesh. b) (30 points) Next, perform a numerical integration on these 2 functions and use text to print out these values in magenta. Choose an appropriate fontname, fontsize and appropriate 3D coordinates for text to positioning the text while printing the numerical integration results on the graphs. To numerically integrate the 2 functions you need to write an anonymous function dened for two surfaces as:
1 fun1 = @(X,Y) ( your vectorized expression for f1(x,y )); 2 num_area1 = integral2 (fun1 ,xmin ,xmax ,ymin , ymax ); 3 fun2 = @(X,Y) ( your vectorized expression for f2(x,y )); 4 num_area2 = integral2 (fun2 ,xmin ,xmax ,ymin , ymax ); Here fun1 and fun2 are the \handles" (or pointers) to anonymous functions (functions that have no name). You can pass this handle to a function as a parameter to another function. Eectively, you can have a function as a parameter to another function. In this assignment, you can integrate functions, fun1 and fun2, using integral2. The Matlab function integral2 evaluates the area under this function using numerical quadrature. c) (10 points) You can use the title command to print out the mathematical formulas for each of the 2 meshes. [An expression is interpreted as latex in Matlab, with _ indicating a subscript and a ^ indicating a superscript. Thus x_2 is x2 while x^2 is x2.] Also use xlabel, ylabel and zlabel to label the x, y and z axes in your gures. Color these using blue, green and red. Also set the font-size to a larger value. Use the 3D version of text to print out the numerical integration results on these graphs (see below). You have to choose the x, y and z values to position these integration values appropriately on the plots. d) (30 points) In some cases, particularly for functions that have singularities (blow-ups to 1), it can be desirable to compute symbolic integrals, not only numerical ones. Can you integrate f1(x; y) and f2(x; y) symbolically in Matlab? To answer this question, attempt to symbolically integrate the 2 functions. To do this you need to declare x and y to be symbol variables, compute f1 and f2 and then evaluate their symbolic integral values. 1 syms x y and then use: 1 f1 =10* sinc ( sqrt (x ^2+y ^2)); 2 sym_area1 = eval (int(int(f1 ,y,ymin , ymax ),x,xmin , xmax )); 3 f2 =18 -3/ sqrt (x^2+y ^2)+ sin( sqrt (x ^2+y ^2))+ 4 ( sqrt (200 -(x^2+y ^2)+10\ sin(x )+10\ sin(y )))/1000; 5 sym_area2 = eval (int(int(f2 ,y,ymin , ymax ),x,xmin , xmax )); to integrate the 2 surfaces. f2 is specied over 2 lines here for printing purposes, you should specify them on a single line in your program. Note the use of eval to evaluate the symbolic integration result. If you are able to integrate either of the functions, verify that the result is the same as the numerical integration result using integral2. If either or both functions are not integrable, state this in a comment and how you know that they are not integrable.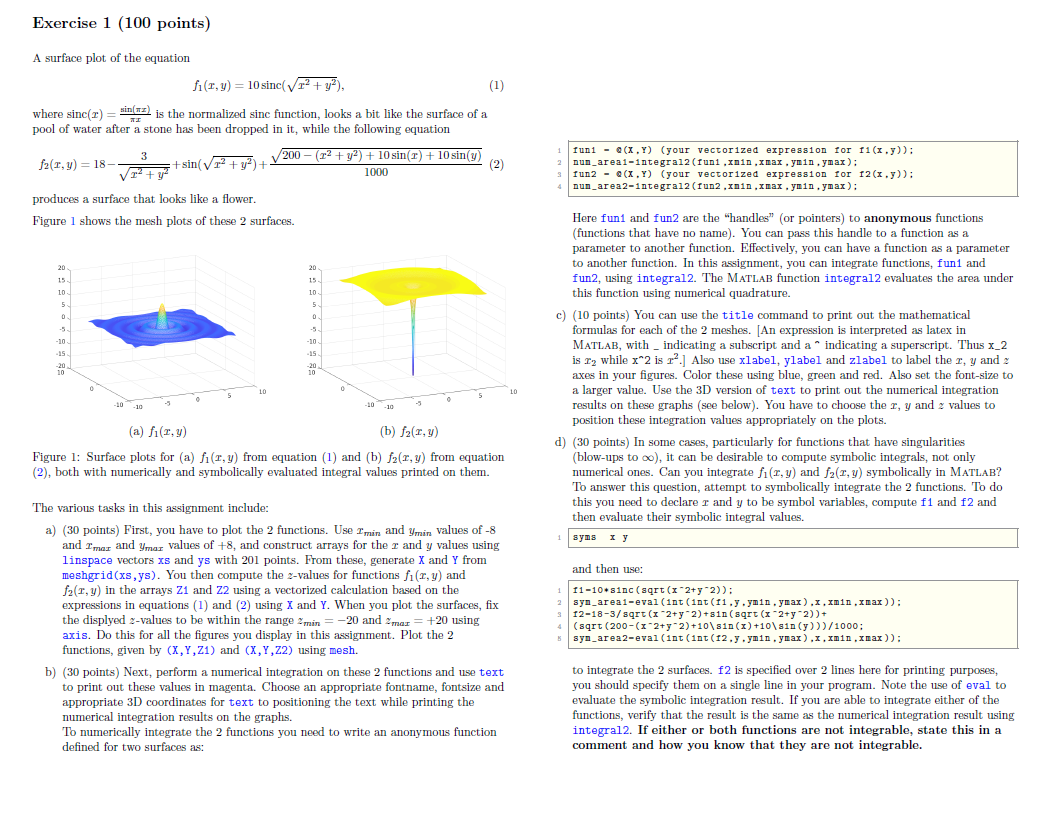
Exercise 1 (100 points) A surface plot of the equation fit,y) = 10 sinc(r2 + y2), (1) where sinc(I) = sin() is the normalized sinc function, looks a bit like the surface of a pool of water after a stone has been dropped in it, while the following equation 3 f2(1,y) = 18 +sin( 12 + y) + 200 - (12 + y2) + 10 sin(T) + 10 sin(y) 1000 (2 Iuni - @(X,Y) (your vectorized expression for 11(x.y)): nun_areai-integral2(funi.xnin.xnax.ynin.ynax): Tun2 - Q(X,Y) (your vectorized expression for 12 (x.y)): nun area 2-integral2(fun2.xnin, max. ymin.ymax): produces a surface that looks like a flower. Figure 1 shows the mesh plots of these 2 surfaces. 20 15 10 in 5 5 -10 -10 -15 20 Here fun and fun2 are the "handles" (or pointers) to anonymous functions (functions that have no name). You can pass this handle to a function as a parameter to another function. Effectively, you can have a function as a parameter to another function. In this assignment, you can integrate functions, funt and fun2, using integral2. The MATLAB function integral evaluates the area under this function using numerical quadrature. c) (10 points) You can use the title command to print out the mathematical formulas for each of the 2 meshes. [An expression is interpreted as latex in MATLAB, with _ indicating a subscript and a " indicating a superscript. Thus x_2 is 12 while x*2 is r?.] Also use xlabel, ylabel and zlabel to label the r, y and axes in your figures. Color these using blue, green and red. Also set the font-size to a larger value. Use the 3D version of text to print out the numerical integration results on these graphs (see below). You have to choose the r, y and 2 values to position these integration values appropriately on the plots. d) (30 points) In some cases, particularly for functions that have singularities (blow-ups to oo), it can be desirable to compute symbolic integrals, not only numerical ones. Can you integrate fit,y) and f(I,y) symbolically in MATLAB? To answer this question, attempt to symbolically integrate the 2 functions. To do this you need to declare r and y to be symbol variables, compute f1 and f2 and then evaluate their symbolic integral values. syms y -10-10 (a) fit,y) (b) 121,y) Figure 1: Surface plots for (a) fi(1,y) from equation (1) and (b) f(I,y) from equation (2), both with numerically and symbolically evaluated integral values printed on them. The various tasks in this assignment include: a) (30 points) First, you have to plot the 2 functions. Use I'min and Ymin values of -8 and Imar and ymar values of +8, and construct arrays for the r and y values using linspace vectors xs and ys with 201 points. From these, generate X and Y from meshgrid(xs,ys). You then compute the 2-values for functions fi(r,y) and 12(1,y) in the arrays Z1 and 22 using a vectorized calculation based on the expressions in equations (1) and (2) using X and Y. When you plot the surfaces, fix the displyed 2-values to be within the range min = -20 and 2 mar +20 using axis. Do this for all the figures you display in this assignment. Plot the 2 functions, given by (X,Y,Z1) and (X,Y,Z2) using mesh. b) (30 points) Next, perform a numerical integration on these 2 functions and use text to print out these values in magenta. Choose an appropriate fontname, fontsize and appropriate 3D coordinates for text to positioning the text while printing the numerical integration results on the graphs. To numerically integrate the 2 functions you need to write an anonymous function defined for two surfaces as: and then use: 11-10-sinc(sqrt(x2+y*2)): 2 syn_areal-eval (int(1nt(11.y.ynin.ynax),x.xmin.xnax)): 12-18-3/sqrt(x+2+y^2)+31(sqrt(x^2+y 2))+ (sqrt(200-(x^2+y 2)+10\810 (X) +10\sin(y)))/1000; syn_area2-eval (int(10t(12..ynin.ymax).x.xnin.xnax)): to integrate the 2 surfaces. f2 is specified over 2 lines here for printing purposes, you should specify them a single line in your program. Note the use of eval to evaluate the symbolic integration result. If you are able to integrate either of the functions, verify that the result is the same as the numerical integration result using integral2. If either or both functions are not integrable, state this in a comment and how you know that they are not integrable
Step by Step Solution
There are 3 Steps involved in it

Get step-by-step solutions from verified subject matter experts