

Question: Matlab Please help A C E 18) In algebra you learned that you can translate, or shift, a function y = f(x) to the right
Matlab Please help A C E
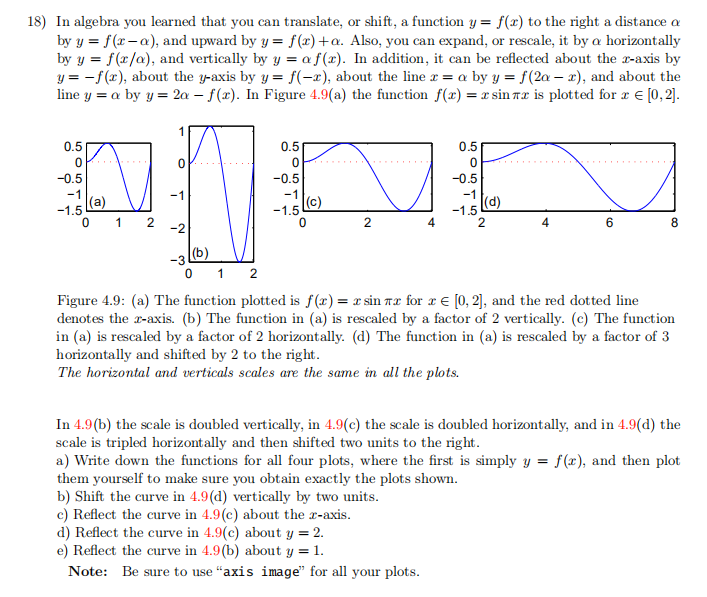
18) In algebra you learned that you can translate, or shift, a function y = f(x) to the right a distance a by y = f(2-a), and upward by y=f(x) +a. Also, you can expand, or rescale, it by a horizontally by y = f(x/a), and vertically by y = a f(x). In addition, it can be reflected about the 2-axis by y= -f(x), about the y-axis by y= f(-x), about the line r = a by y = f(2a ), and about the line y = a by y = 2a f(2). In Figure 4.9(a) the function f(x) = x sin ax is plotted for 2 (0,2). 1 0 0.5 0 -0.5 -1 (a) -1.5 0 0.5 0 -0.5 -1 (c) -1.5 0.5 0 -0.5 -1 (d) -1.5 2 -1 1 2 2 4 6 8 -2 (6) -3 0 1 2 Figure 4.9: (a) The function plotted is f(x)= x sin ax for 2 (0,2), and the red dotted line denotes the c-axis. (b) The function in (a) is rescaled by a factor of 2 vertically. (c) The function in (a) is rescaled by a factor of 2 horizontally. (d) The function in (a) is rescaled by a factor of 3 horizontally and shifted by 2 to the right. The horizontal and verticals scales are the same in all the plots. In 4.9(b) the scale is doubled vertically, in 4.9(c) the scale is doubled horizontally, and in 4.9(d) the scale is tripled horizontally and then shifted two units to the right. a) Write down the functions for all four plots, where the first is simply y = f(x), and then plot them yourself to make sure you obtain exactly the plots shown. b) Shift the curve in 4.9(d) vertically by two units. c) Reflect the curve in 4.9(e) about the l-axis. d) Reflect the curve in 4.9(e) about y = 2. e) Reflect the curve in 4.9(b) about y = 1. Note: Be sure to use "axis image for all your plots. 18) In algebra you learned that you can translate, or shift, a function y = f(x) to the right a distance a by y = f(2-a), and upward by y=f(x) +a. Also, you can expand, or rescale, it by a horizontally by y = f(x/a), and vertically by y = a f(x). In addition, it can be reflected about the 2-axis by y= -f(x), about the y-axis by y= f(-x), about the line r = a by y = f(2a ), and about the line y = a by y = 2a f(2). In Figure 4.9(a) the function f(x) = x sin ax is plotted for 2 (0,2). 1 0 0.5 0 -0.5 -1 (a) -1.5 0 0.5 0 -0.5 -1 (c) -1.5 0.5 0 -0.5 -1 (d) -1.5 2 -1 1 2 2 4 6 8 -2 (6) -3 0 1 2 Figure 4.9: (a) The function plotted is f(x)= x sin ax for 2 (0,2), and the red dotted line denotes the c-axis. (b) The function in (a) is rescaled by a factor of 2 vertically. (c) The function in (a) is rescaled by a factor of 2 horizontally. (d) The function in (a) is rescaled by a factor of 3 horizontally and shifted by 2 to the right. The horizontal and verticals scales are the same in all the plots. In 4.9(b) the scale is doubled vertically, in 4.9(c) the scale is doubled horizontally, and in 4.9(d) the scale is tripled horizontally and then shifted two units to the right. a) Write down the functions for all four plots, where the first is simply y = f(x), and then plot them yourself to make sure you obtain exactly the plots shown. b) Shift the curve in 4.9(d) vertically by two units. c) Reflect the curve in 4.9(e) about the l-axis. d) Reflect the curve in 4.9(e) about y = 2. e) Reflect the curve in 4.9(b) about y = 1. Note: Be sure to use "axis image for all your plots
Step by Step Solution
There are 3 Steps involved in it

Get step-by-step solutions from verified subject matter experts