

Question: MATLAB Plot- URGENT. I am trying to plot for a variable incrementing 1:K for a specified value K. The variable in question is P, which
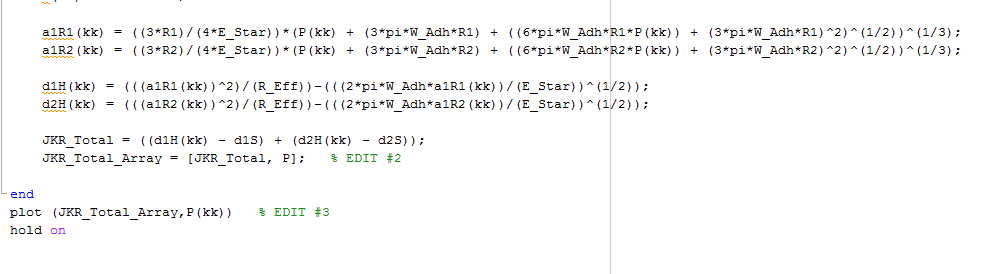
MATLAB Plot- URGENT. I am trying to plot for a variable incrementing 1:K for a specified value K. The variable in question is P, which is to by my y-axis. The plot itself is an attempt at modeling a JKR/Hertzian contact mechanics curve for a given specimen I have used. I have written all the constants and provided the equations as they are in the MATLAB code I have written. There are several problems: . The plot won't graph. It will open up the window and no curve or point is plotted.
. The workspace shows incorrect values for constants a0R1 and a0R2, including other constants. If you calculate them by hand using the variables I have provided, you will see what I mean.
. The values in the workspace seem to be overwriting each other so I don't know how to plot JKR_Total for a continuous stream of varying P, by increments of deltaP = 0.4e-8. The code is attached as two pictures below:
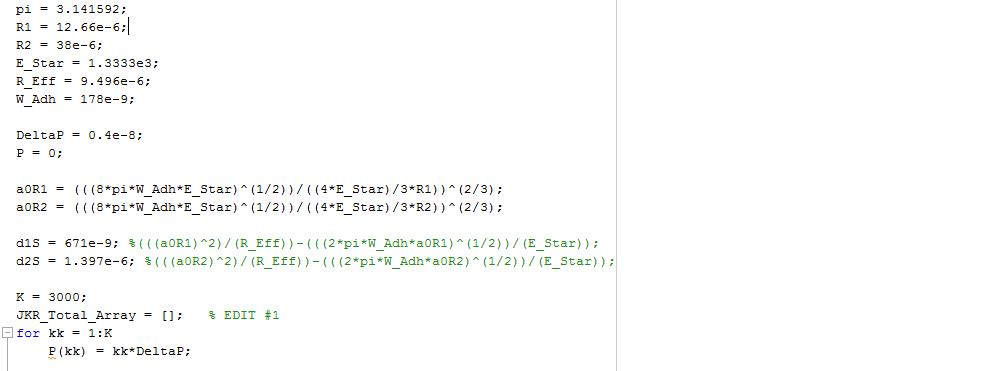
pi 3.141592 R1. 12.66e-6 R2 38e-6 E Star 1. 3333e3 R Eff 9.496e-6 W Adh. 178 Delta 0.4e a0R1. 8 pi W Adh E Star (1/2 4 Star /3*R 1)) 2/3 a0R2 8 pi W Adh E Star) 1/2 4 E Star) /3*R2)) 2/3 15 671 (a 2) (R Eff 2*pi*W Adh aOR1) 1/2) (E Star) aOR1 d2s 1.397 e-6 aOR2 2) (R Eff 2*pi. W Adh aOR2) (1/2)) (E Star) 3000 JKR Total Array EDIT #1 for kk 1:K P (kk) kk Delta
Step by Step Solution
There are 3 Steps involved in it

Get step-by-step solutions from verified subject matter experts