

Question: MATLAB PLOTTING QUESTION 7. Using the following functions, create the below 3D charts: Z1(x,y)- sin(x) z26.y)COSG2 cos(y) z3(x,y) -zi(x,y) + z2(x, y) sin(y)/y z3- sin(x)^x
MATLAB PLOTTING QUESTION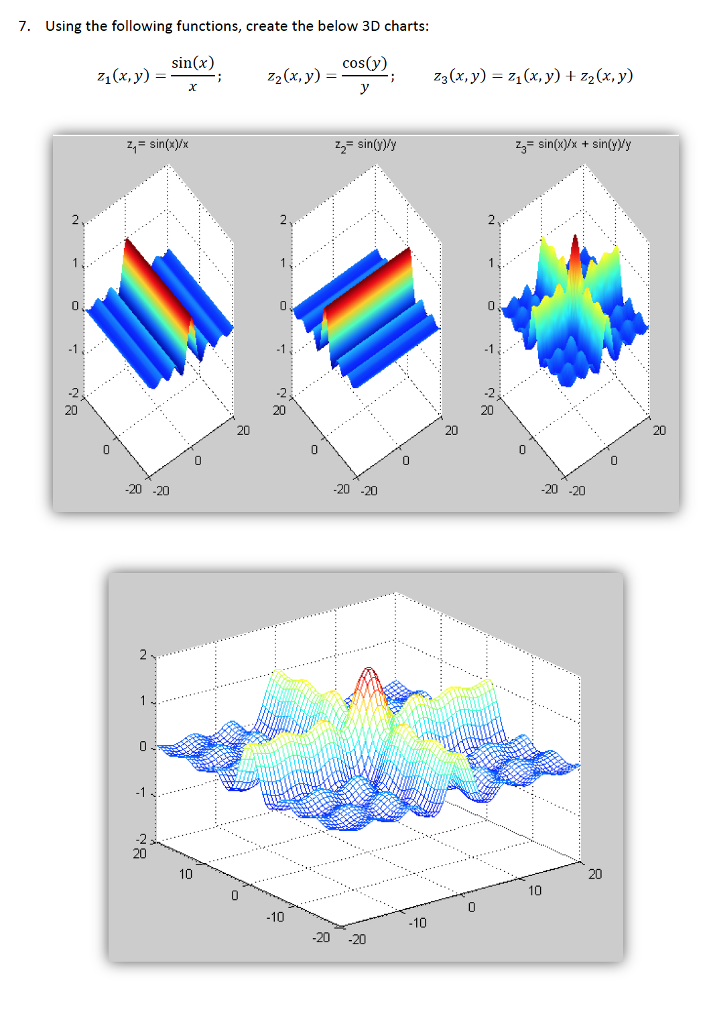
7. Using the following functions, create the below 3D charts: Z1(x,y)- sin(x) z26.y)COSG2 cos(y) z3(x,y) -zi(x,y) + z2(x, y) sin(y)/y z3- sin(x)^x + sin(yVy 0 20 20 20 20 20 20 20 20 20 20 -20 10 20 10 10 20 -20
Step by Step Solution
There are 3 Steps involved in it
1 Expert Approved Answer
Step: 1 Unlock

Question Has Been Solved by an Expert!
Get step-by-step solutions from verified subject matter experts
Step: 2 Unlock
Step: 3 Unlock