

Question: MATLAB problem, please give me a hand. Consider the function f(x) = [sin (2x) + cos^2(5x)]. E^-0.2x in the interval 0 lessthanorequalto x lessthanorequalto 6.
MATLAB problem, please give me a hand.
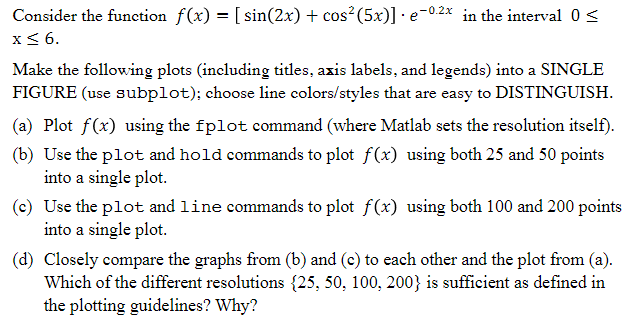
Consider the function f(x) = [sin (2x) + cos^2(5x)]. E^-0.2x in the interval 0 lessthanorequalto x lessthanorequalto 6. Make the following plots including titles, axis labels, and legends) into a SINGLE FIGURE (use subplot); choose line colors/styles that are easy to DISTINGUISH. (a) Plot f (x) using the fplot command (where Matlab sets the resolution itself) (b) Use the plot and hold commands to plot f(x) using both 25 and 50 points into a single plot. (c) Use the plot and line commands to plot f(x) using both 100 and 200 points into a single plot. (d) Closely compare the graphs from (b) and (c to each other and the plot from (a). Which of the different resolutions {25, 50, 100, 200} is sufficient as defined in the plotting guidelines? Why
Step by Step Solution
There are 3 Steps involved in it

Get step-by-step solutions from verified subject matter experts