

Question: Matlab problem Question 4 Plot the function y=x2-2x+1 a). b) The following table shows the average high temperatures for three rooms for each month of
Matlab problem 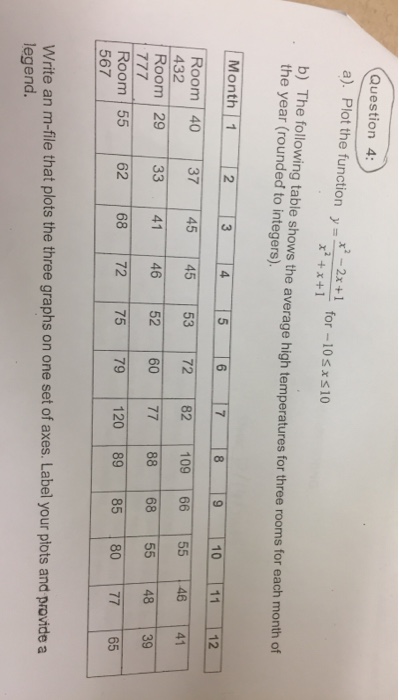
Question 4 Plot the function y=x2-2x+1 a). b) The following table shows the average high temperatures for three rooms for each month of the year (rounded to integers). for-10 s10 Room 40 37 45 45 53282 09 66 5541 432 Room 29-33-T41-465260-177-T88-68-155-48-39 120- 89185-180-t77-165 Room 155 6268 72-175-t79 567 Write an m-file that plots the three graphs on one set of axes. Label your plots and provide a legend
Step by Step Solution
There are 3 Steps involved in it
1 Expert Approved Answer
Step: 1 Unlock

Question Has Been Solved by an Expert!
Get step-by-step solutions from verified subject matter experts
Step: 2 Unlock
Step: 3 Unlock