

Question: MATLAB PROGRAMMING 3.6, 3.7, 3.8 Create a polar plot of the function r (theta) = sin (2 theta) cos 6 for 0 lessthanorequalto theta lessthanorequalto
MATLAB PROGRAMMING
3.6, 3.7, 3.8
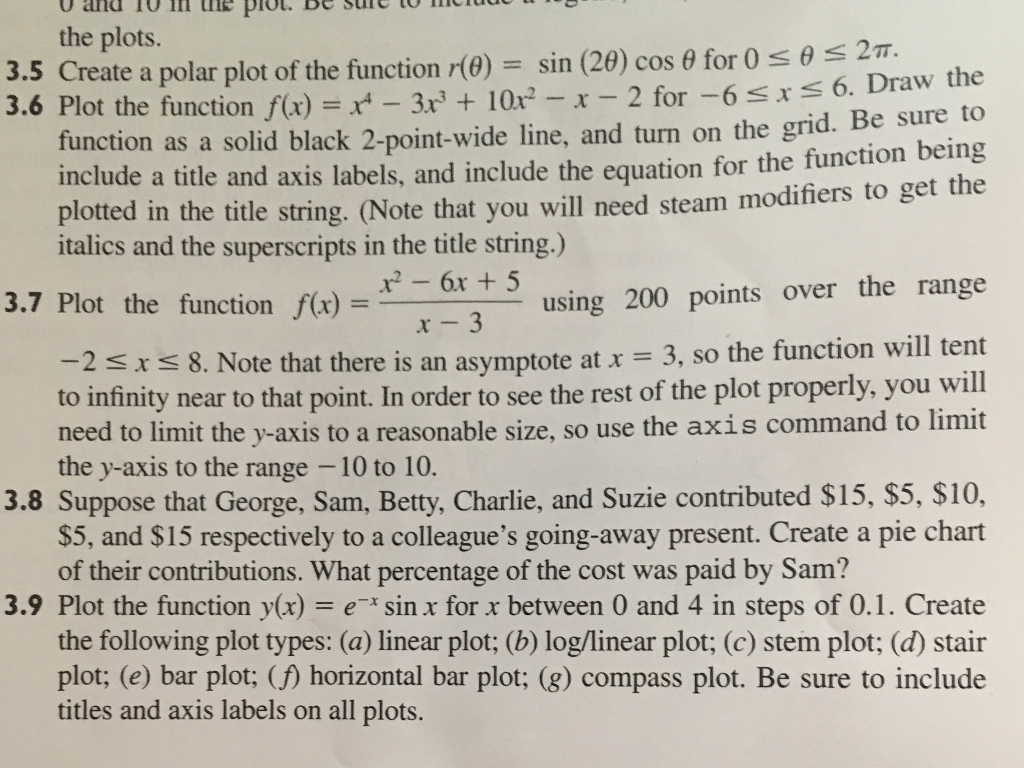
Create a polar plot of the function r (theta) = sin (2 theta) cos 6 for 0 lessthanorequalto theta lessthanorequalto 2 pi Plot the function f (x) = x^4 - 3x^3 + 10x^2 - x - 2 for - 6 lessthanorequalto x lessthanorequalto 6. Draw the function as a solid black 2-point-wide line, and turn on the grid. Be sure to include a title and axis labels, and include the equation for the function being plotted in the title string. (Note that you will need steam modifiers to get the italics and the superscripts in the title string.) Plot the function f(x) = x^2 - 6x + 5/x - 3 using 200 points over the range -2 lessthanorequalto x lessthanorequalto 8. Note that there is an asymptote at x = 3, so the function will tent to infinity near to that point. In order to see the rest of the plot properly, you will need to limit the v-axis to a reasonable size, so use the axis command to limit the y-axis to the range -10 to 10. Suppose that George, Sam, Betty, Charlie, and Suzie contributed $15, $5, $10, $5, and $15 respectively to a colleague's going-away present. Create a pie chart of their contributions. What percentage of the cost was paid by Sam? Plot the function y (x) = e^-x sin x for x between 0 and 4 in steps of 0.1. Create the following plot types: linear plot; log/linear plot; stem plot; stair plot; bar plot; horizontal bar plot; compass plot. Be sure to include titles and axis labels on all plots. Create a polar plot of the function r (theta) = sin (2 theta) cos 6 for 0 lessthanorequalto theta lessthanorequalto 2 pi Plot the function f (x) = x^4 - 3x^3 + 10x^2 - x - 2 for - 6 lessthanorequalto x lessthanorequalto 6. Draw the function as a solid black 2-point-wide line, and turn on the grid. Be sure to include a title and axis labels, and include the equation for the function being plotted in the title string. (Note that you will need steam modifiers to get the italics and the superscripts in the title string.) Plot the function f(x) = x^2 - 6x + 5/x - 3 using 200 points over the range -2 lessthanorequalto x lessthanorequalto 8. Note that there is an asymptote at x = 3, so the function will tent to infinity near to that point. In order to see the rest of the plot properly, you will need to limit the v-axis to a reasonable size, so use the axis command to limit the y-axis to the range -10 to 10. Suppose that George, Sam, Betty, Charlie, and Suzie contributed $15, $5, $10, $5, and $15 respectively to a colleague's going-away present. Create a pie chart of their contributions. What percentage of the cost was paid by Sam? Plot the function y (x) = e^-x sin x for x between 0 and 4 in steps of 0.1. Create the following plot types: linear plot; log/linear plot; stem plot; stair plot; bar plot; horizontal bar plot; compass plot. Be sure to include titles and axis labels on all plots
Step by Step Solution
There are 3 Steps involved in it

Get step-by-step solutions from verified subject matter experts