

Question: 2 Question 2 Data on the vapor pressure P of water as a function of temperature T are given in the following table. Determine
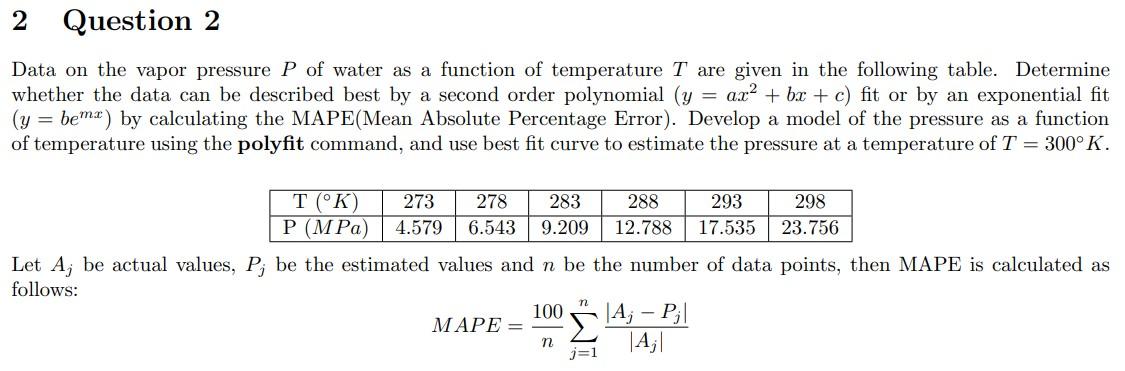
2 Question 2 Data on the vapor pressure P of water as a function of temperature T are given in the following table. Determine whether the data can be described best by a second order polynomial (y ax+bx+c) fit or by an exponential fit (y= bema) by calculating the MAPE(Mean Absolute Percentage Error). Develop a model of the pressure as a function of temperature using the polyfit command, and use best fit curve to estimate the pressure at a temperature of T = 300 K. T (K) 273 278 283 P (MPa) 4.579 6.543 9.209 MAPE= Let A, be actual values, P; be the estimated values and n be the number of data points, then MAPE is calculated as follows: 288 293 12.788 17.535 n 100 |Aj - Pj| |A| n j=1 298 23.756 2 Question 2 Data on the vapor pressure P of water as a function of temperature T are given in the following table. Determine whether the data can be described best by a second order polynomial (y ax+bx+c) fit or by an exponential fit (y= bema) by calculating the MAPE(Mean Absolute Percentage Error). Develop a model of the pressure as a function of temperature using the polyfit command, and use best fit curve to estimate the pressure at a temperature of T = 300 K. T (K) 273 278 283 P (MPa) 4.579 6.543 9.209 MAPE= Let A, be actual values, P; be the estimated values and n be the number of data points, then MAPE is calculated as follows: 288 293 12.788 17.535 n 100 |Aj - Pj| |A| n j=1 298 23.756 2 Question 2 Data on the vapor pressure P of water as a function of temperature T are given in the following table. Determine whether the data can be described best by a second order polynomial (y ax+bx+c) fit or by an exponential fit (y= bema) by calculating the MAPE(Mean Absolute Percentage Error). Develop a model of the pressure as a function of temperature using the polyfit command, and use best fit curve to estimate the pressure at a temperature of T = 300 K. T (K) 273 278 283 P (MPa) 4.579 6.543 9.209 MAPE= Let A, be actual values, P; be the estimated values and n be the number of data points, then MAPE is calculated as follows: 288 293 12.788 17.535 n 100 |Aj - Pj| |A| n j=1 298 23.756 2 Question 2 Data on the vapor pressure P of water as a function of temperature T are given in the following table. Determine whether the data can be described best by a second order polynomial (y ax+bx+c) fit or by an exponential fit (y= bema) by calculating the MAPE(Mean Absolute Percentage Error). Develop a model of the pressure as a function of temperature using the polyfit command, and use best fit curve to estimate the pressure at a temperature of T = 300 K. T (K) 273 278 283 P (MPa) 4.579 6.543 9.209 MAPE= Let A, be actual values, P; be the estimated values and n be the number of data points, then MAPE is calculated as follows: 288 293 12.788 17.535 n 100 |Aj - Pj| |A| n j=1 298 23.756
Step by Step Solution
3.38 Rating (157 Votes )
There are 3 Steps involved in it

Get step-by-step solutions from verified subject matter experts