

Question: MATLAB Question Im using this example from MATLAB, but Im trying to use a different image for the results. I dont understand why the code
MATLAB Question
Im using this example from MATLAB, but Im trying to use a different image for the results. I dont understand why the code breaks when I use a different image:
Matlab Example: I = imread('circuit.tif'); rotI = imrotate(I,33,'crop'); BW = edge(rotI,'canny'); [H,T,R] = hough(BW); imshow(H,[],'XData',T,'YData',R,'InitialMagnification','fit'); xlabel('\theta'), ylabel(' ho'); axis on, axis normal, hold on; P = houghpeaks(H,5,'threshold',ceil(0.3*max(H(:)))); x = T(P(:,2)); y = R(P(:,1)); plot(x,y,'s','color','white'); % Find lines and plot them lines = houghlines(BW,T,R,P,'FillGap',5,'MinLength',7); figure, imshow(rotI), hold on max_len = 0; for k = 1:length(lines) xy = [lines(k).point1; lines(k).point2]; plot(xy(:,1),xy(:,2),'LineWidth',2,'Color','green');
% Plot beginnings and ends of lines plot(xy(1,1),xy(1,2),'x','LineWidth',2,'Color','yellow'); plot(xy(2,1),xy(2,2),'x','LineWidth',2,'Color','red');
% Determine the endpoints of the longest line segment len = norm(lines(k).point1 - lines(k).point2); if ( len > max_len) max_len = len; xy_long = xy; end end
% highlight the longest line segment plot(xy_long(:,1),xy_long(:,2),'LineWidth',2,'Color','cyan');
What I'm Trying to DO: I = imread('test1.tiff'); rotI = imrotate(I,33,'crop'); BW = edge(rotI,'canny'); [H,T,R] = hough(BW); imshow(H,[],'XData',T,'YData',R,'InitialMagnification','fit'); xlabel('\theta'), ylabel(' ho'); axis on, axis normal, hold on; P = houghpeaks(H,5,'threshold',ceil(0.3*max(H(:)))); x = T(P(:,2)); y = R(P(:,1)); plot(x,y,'s','color','white'); % Find lines and plot them lines = houghlines(BW,T,R,P,'FillGap',5,'MinLength',7); figure, imshow(rotI), hold on max_len = 0; for k = 1:length(lines) xy = [lines(k).point1; lines(k).point2]; plot(xy(:,1),xy(:,2),'LineWidth',2,'Color','green');
% Plot beginnings and ends of lines plot(xy(1,1),xy(1,2),'x','LineWidth',2,'Color','yellow'); plot(xy(2,1),xy(2,2),'x','LineWidth',2,'Color','red');
% Determine the endpoints of the longest line segment len = norm(lines(k).point1 - lines(k).point2); if ( len > max_len) max_len = len; xy_long = xy; end end
% highlight the longest line segment plot(xy_long(:,1),xy_long(:,2),'LineWidth',2,'Color','cyan');
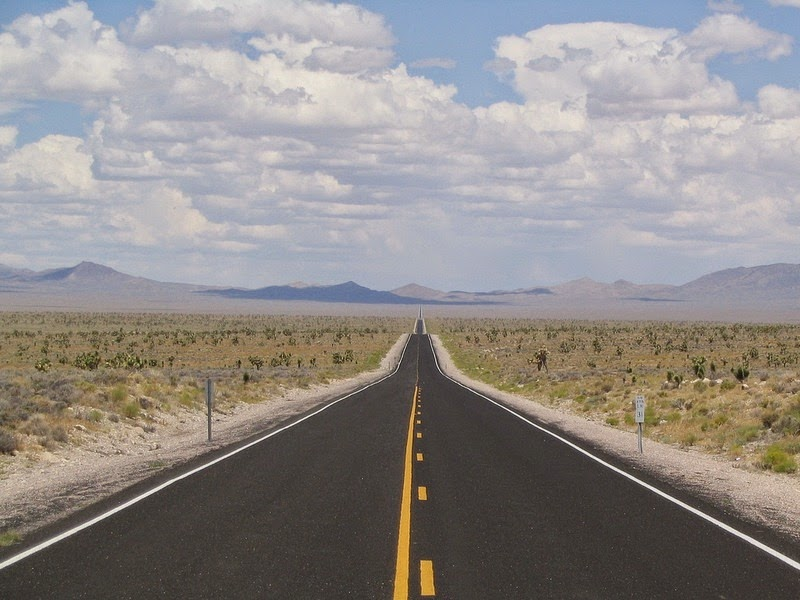
test1.jpeg

test1.tiff
Transcribed image text
Step by Step Solution
There are 3 Steps involved in it

Get step-by-step solutions from verified subject matter experts