

Question: MATLAB QUESTION rng(123); % set random number generator using integer seed value of 123 % | % Need to use rng(123); immediately before the next
MATLAB QUESTION
rng(123); % set random number generator using integer seed value of 123 % | % Need to use rng(123); immediately before the next two lines of code x = 10*rand(1,250)-5; % array of 250 random value such that -5.0
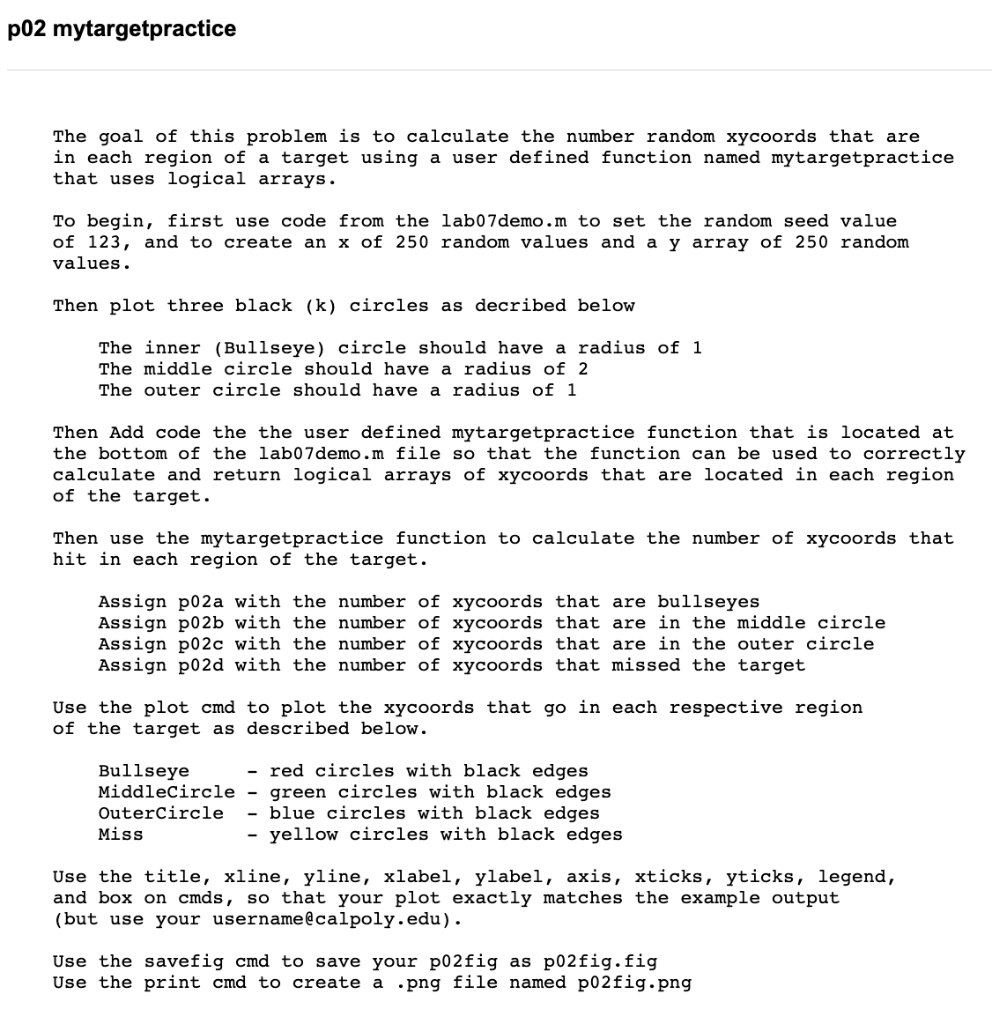
% user defined function #6 - you need to add code to this function% user defined function #6 - you need to add code to this function function [bullseye,middle,outer,missed] = mytargetpractice(x,y) % function mytargetpractice takes two input scalar parameters, x and y, % and returns 4 output parameters, bullseye, middle, outer, missed % % Example: % [bullseye,middle,outer,missed] = mytargetpractice(x,y); % % NOTE % % You do not need to clear variables used in function definition % % IMPORTANT % % NOTE you need to add RHS code that uses logical arrays to calculate % and assign (=) the correct values to each of the output parameters % % bullseye = add_RHS_code ; % See Hint % middle = add_RHS_code ; % See Hint % outer = add_RHS_code ; % use a semicolon (;) to suppress all output % missed = add_RHS_code ; % use a semicolon (;) to suppress all output d = sqrt(x.^2+y.^2); % Hint: use array logical & to calc middle and outer circle locations, end % Add code to the mytargetpractice function above this lineThe goal of this problem is to calculate the number random xycoords that are in each region of a target using a user defined function named mytargetpractice that uses logical arrays. To begin, first use code from the lab07demo.m to set the random seed value of 123 , and to create an x of 250 random values and a y array of 250 random values. Then plot three black (k) circles as decribed below The inner (Bullseye) circle should have a radius of 1 The middle circle should have a radius of 2 The outer circle should have a radius of 1 Then Add code the the user defined mytargetpractice function that is located at the bottom of the lab07demo.m file so that the function can be used to correctly calculate and return logical arrays of xycoords that are located in each region of the target. Then use the mytargetpractice function to calculate the number of xycoords that hit in each region of the target. Assign p02a with the number of xycoords that are bullseyes Assign p02b with the number of xycoords that are in the middle circle Assign p02c with the number of xycoords that are in the outer circle Assign p02d with the number of xycoords that missed the target Use the plot and to plot the xycoords that go in each respective region of the target as described below. Bullseye - red circles with black edges MiddleCircle - green circles with black edges Outercircle - blue circles with black edges Miss - yellow circles with black edges Use the title, xline, yline, xlabel, ylabel, axis, xticks, yticks, legend, and box on cmds, so that your plot exactly matches the example output (but use your usernamelcalpoly.edu). Use the savefig and to save your p02fig as p02fig.fig Use the print cmd to create a png file named p02fig.png
Step by Step Solution
There are 3 Steps involved in it
1 Expert Approved Answer
Step: 1 Unlock

Question Has Been Solved by an Expert!
Get step-by-step solutions from verified subject matter experts
Step: 2 Unlock
Step: 3 Unlock