

Question: MatLab R2017 Software is being used to code: %AM Modulation; clear; Ac=5; Am=4; fc=10500; fm=600; t=0:0.00001:0.003; m=Am*cos(2*pi*fm*t); c=Ac*cos(2*pi*fc*t); mi = Am/Ac; s=Ac*(1+mi*cos(2*pi*fm*t)).*cos(2*pi*fc*t); subplot(2,2,1); plot(t,s); xlabel('time');
MatLab R2017 Software is being used to code:
%AM Modulation; clear; Ac=5; Am=4; fc=10500; fm=600; t=0:0.00001:0.003; m=Am*cos(2*pi*fm*t); c=Ac*cos(2*pi*fc*t); mi = Am/Ac; s=Ac*(1+mi*cos(2*pi*fm*t)).*cos(2*pi*fc*t); subplot(2,2,1); plot(t,s); xlabel('time'); ylabel('amplitude'); title('AM modulation'); subplot(2,2,4); plot(t,m); xlabel('time'); ylabel('amplitude'); title('Message'); subplot(2,2,2); plot (t,c); xlabel('time'); ylabel('amplitude'); title('Carrier'); subplot(2,2,3); yyaxis left; plot(t,m); ylim([-40 40]) yyaxis right; plot(t,s); ylim([-40 40]) title('combined message and signal');
Step 2.5 Now change the message amplitude, Am, to 50 and plot signal. Answer the following question.
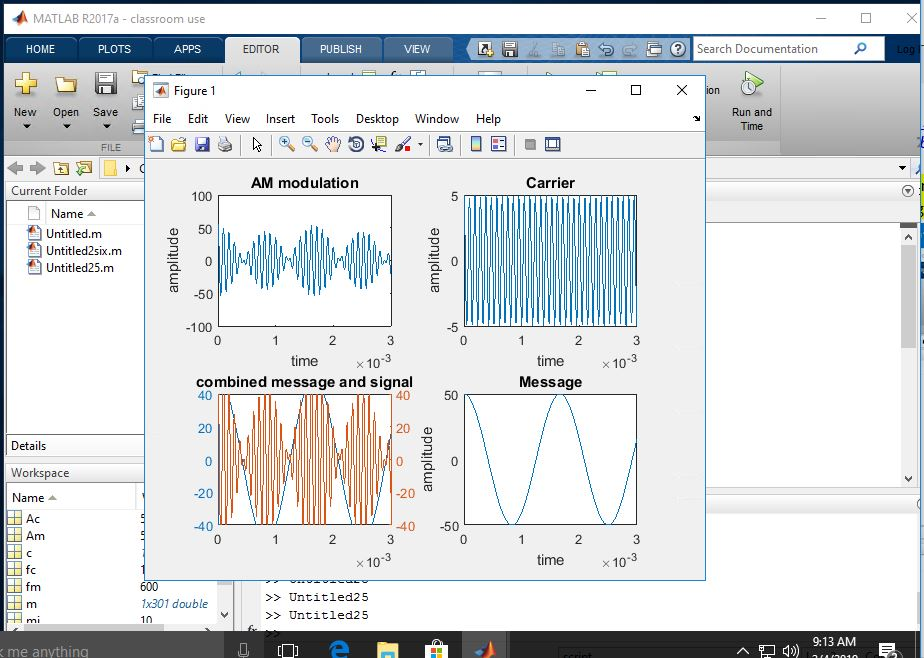
Question 2.5 Having changed the message amplitude to Am=50, select the correct statement a. The signal, s(t), faithfully represents the original message wave m(t) b. It is more difficult to clearly see a correlation between changes in m(t) and s(t); as such distortion is being experienced by the modulated carrier wave s(t) c. Since only the amplitude of the message wave has increased, there is no negative impact to the modulated carrier signal d. None of the above are correct
Step 2.6 Next, change the frequency of the message to fm=1700 and the message amplitude to Am=5. Make sure to plot the combined message and modulated carrier signal onto a single plot using the MatLab code above.
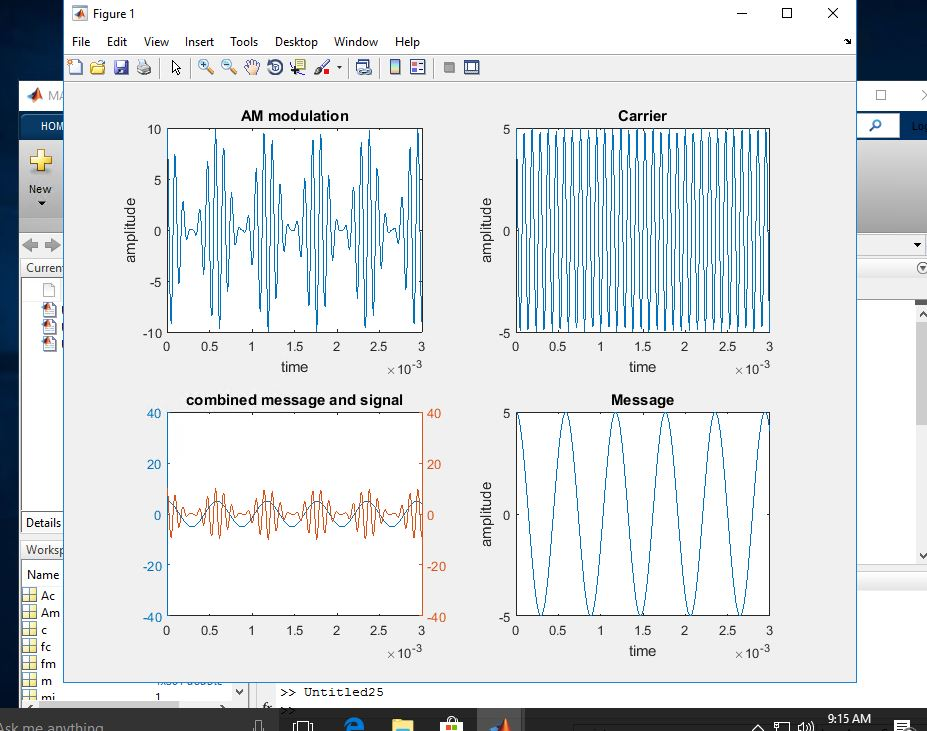 Question 2.6 Select the correct statement that describes what you see in the plots: a. The signal, s(t), is distorted by the dramatic change in message frequency. b. The message amplitude change can be seen in the signal plot of s(t). When comparing plots for s(t) and m(t), it is obvious that the signal accurately represents the message. c. Both the message and carrier frequencies increase, therefore distortion will be experienced. d. The phase of the signal has shifted to the right, because AM techniques impact phase and amplitude.
MATLAB R2017a-classroom use HOME ( |Search Documentation PLOTS APPS EDITOR iqure New Open Save File Edit View nsert Tools Desktop Window Help Run and Time AM modulation Carrier Current Folder 100 Name Untitled. m 50 Untitled25m -100 -3 time x 103 Message time 10 combined message and signal 40 40 5 20 20 Workspace Name Ac Am -20 40 40 -50 10 time x 10 -3 fc fm mi 1x301 double 10 >Untitled25 >> Untitled25 9:13 AM me anything Figure1 File Edit View nsert Tools Desktop Window Help AM modulation Carrier HO 10 New -5 -10 0 0.5 1.5 22.5 3 0 0.5 1.5 22.5 3 time x 10 time 10 combined message and signal Message 20 20 Details Works Name Ac -20 -20 -40 40 0 0.5 1.5 22.5 3 0 0.5 1.5 22.53 fc 10 time x 10 fm Untitled25 F9:15 AM
Step by Step Solution
There are 3 Steps involved in it

Get step-by-step solutions from verified subject matter experts