

Question: MATLAB Script needed, thank you! Projectile Motion The equation for the height of a projectile, y (m), is: 1 y = + V, sin(O) t+y.
MATLAB Script needed, thank you!
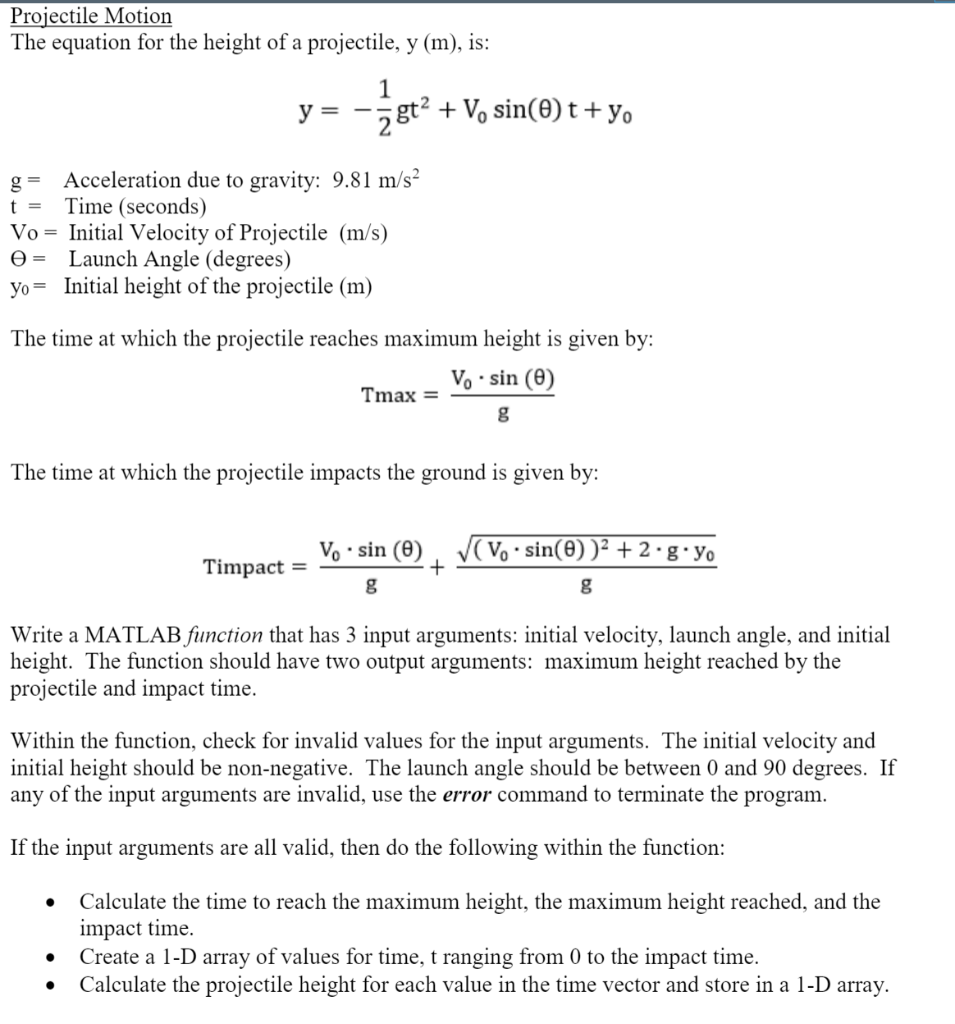
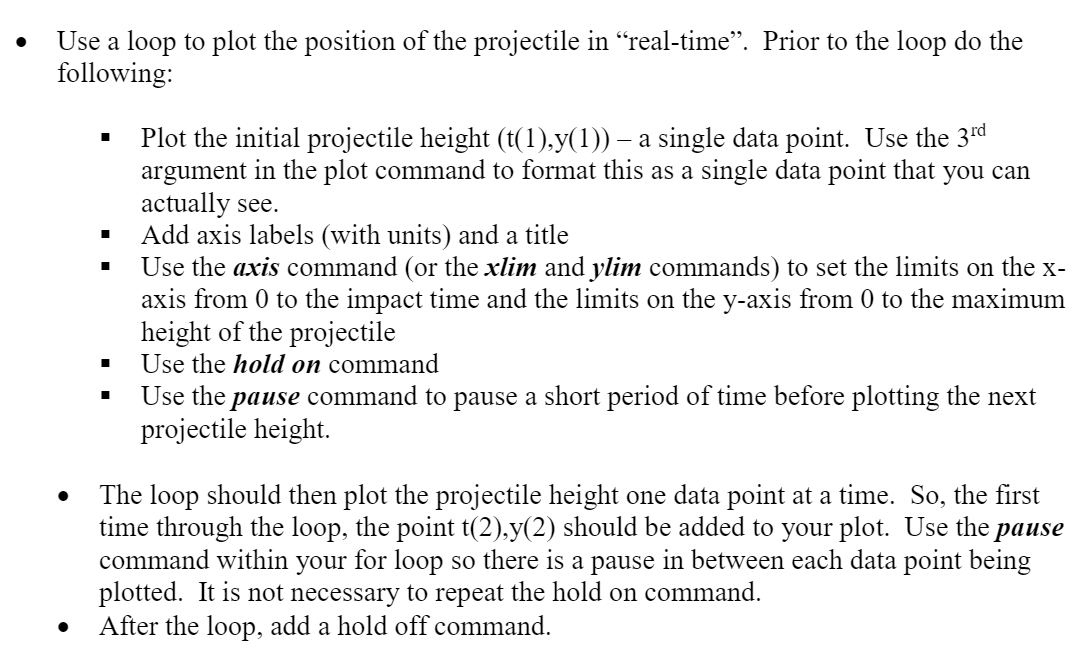
Projectile Motion The equation for the height of a projectile, y (m), is: 1 y = + V, sin(O) t+y. 28t2 t = Acceleration due to gravity: 9.81 m/s Time (seconds) Vo = Initial Velocity of Projectile (m/s) = Launch Angle (degrees) yo= Initial height of the projectile (m) The time at which the projectile reaches maximum height is given by: V. sin (0) Tmax = g The time at which the projectile impacts the ground is given by: (V..sin(O))2 +2.g.yo Timpact = V..sin () + g g Write a MATLAB function that has 3 input arguments: initial velocity, launch angle, and initial height. The function should have two output arguments: maximum height reached by the projectile and impact time. Within the function, check for invalid values for the input arguments. The initial velocity and initial height should be non-negative. The launch angle should be between 0 and 90 degrees. If any of the input arguments are invalid, use the error command to terminate the program. If the input arguments are all valid, then do the following within the function: Calculate the time to reach the maximum height, the maximum height reached, and the impact time. Create a 1-D array of values for time, t ranging from 0 to the impact time. Calculate the projectile height for each value in the time vector and store in a 1-D array. Use a loop to plot the position of the projectile in real-time. Prior to the loop do the following: Plot the initial projectile height (t(1),y(1)) - a single data point. Use the 3rd argument in the plot command to format this as a single data point that you can actually see. Add axis labels (with units) and a title Use the axis command (or the xlim and ylim commands) to set the limits on the x- axis from 0 to the impact time and the limits on the y-axis from 0 to the maximum height of the projectile Use the hold on command Use the pause command to pause a short period of time before plotting the next projectile height The loop should then plot the projectile height one data point at a time. So, the first time through the loop, the point t(2),y(2) should be added to your plot. Use the pause command within your for loop so there is a pause in between each data point being plotted. It is not necessary to repeat the hold on command. After the loop, add a hold off command
Step by Step Solution
There are 3 Steps involved in it

Get step-by-step solutions from verified subject matter experts