

Question: Matlab Script, plot only one graph with the outputs Write a Matlab script that Accepts 3 inputs from the user representing the coefficients a, b,
 Matlab Script, plot only one graph with the outputs
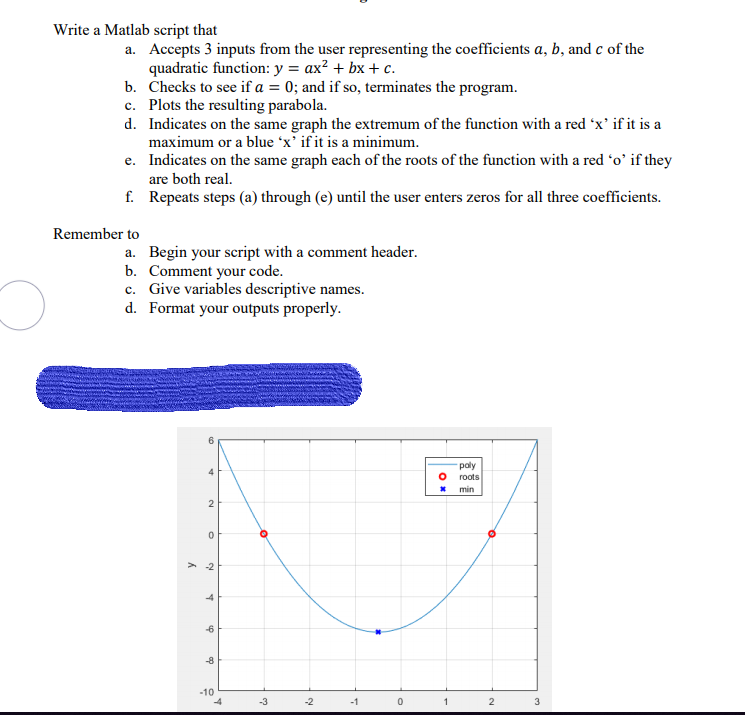
Write a Matlab script that Accepts 3 inputs from the user representing the coefficients a, b, and c of the a. quadratic function: y ax2 bx c b. Checks to see if a -0; and if so, terminates the program. c. Plots the resulting parabola. d. Indicates on the same graph the extremum of the function with a red 'x' if it isa maximum or a blue 'x' if it is a minimum. Indicates on the same graph each of the roots of the function with a red 'o' if they are both real. Repeats steps (a) through (e) until the user enters zeros for all three coefficients. e. f. Remember to a. b. c. d. Begin your script with a comment header Comment your code Give variables descriptive names. Format your outputs properly roots min -6 -8 10 -3 -2
Step by Step Solution
There are 3 Steps involved in it

Get step-by-step solutions from verified subject matter experts