

Question: matlab scripting language 12 Data Visualization, Find Command Rainfall data for Palm Beach, Florida, from Jan to Dec, 2020, is provided in the following table.
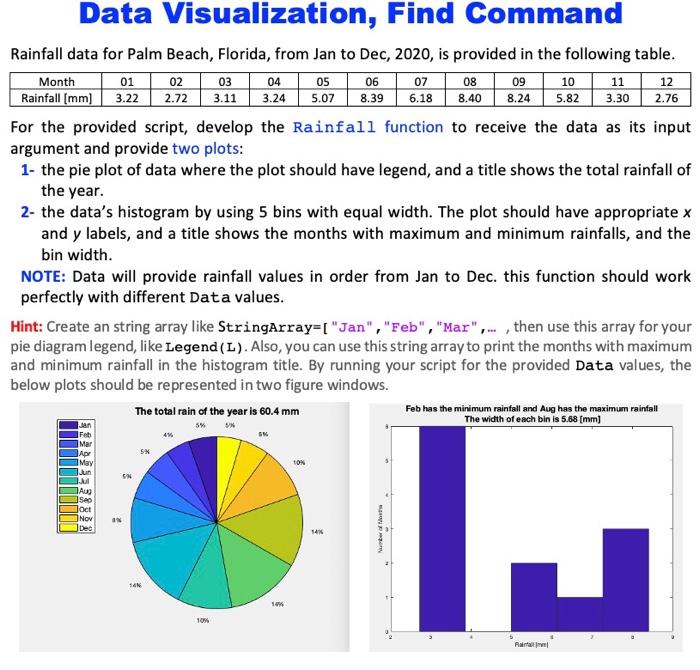
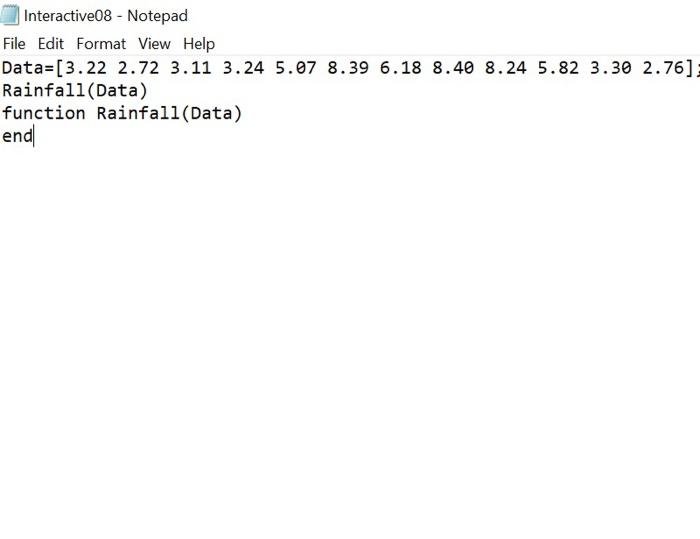
12 Data Visualization, Find Command Rainfall data for Palm Beach, Florida, from Jan to Dec, 2020, is provided in the following table. Month 01 02 03 04 05 06 07 08 09 10 11 Rainfall (mm) 3.22 2.72 3.11 3.24 5.07 8.39 6.18 8.40 8.245.82 3.30 2.76 For the provided script, develop the Rainfall function to receive the data as its input argument and provide two plots: 1- the pie plot of data where the plot should have legend, and a title shows the total rainfall of the year. 2- the data's histogram by using 5 bins with equal width. The plot should have appropriate x and y labels, and a title shows the months with maximum and minimum rainfalls, and the bin width. NOTE: Data will provide rainfall values in order from Jan to Dec. this function should work perfectly with different Data values. Hint: Create an string array like StringArray=[ "Jan", "Feb", "Mar"..., then use this array for your pie diagram legend, like Legend (L). Also, you can use this string array to print the months with maximum and minimum rainfall in the histogram title. By running your script for the provided Data values, the below plots should be represented in two figure windows. The total rain of the year is 60.4 mm Feb has the minimum rainfall and Aug has the maximum rainfall The width of each bin is 5.68 [mm] 5 4 Feb Mar ADY May SN TON EN . Aug Sep Joct Nov JDec 54% J Number 94 RI Interactive08 - Notepad File Edit Format View Help Data=[3.22 2.72 3.11 3.24 5.07 8.39 6.18 8.40 8.24 5.82 3.30 2.76] Rainfall (Data) function Rainfall (Data) end
Step by Step Solution
There are 3 Steps involved in it

Get step-by-step solutions from verified subject matter experts