

Question: MATLAB Section 3: Plot SCC Create a plot that looks like the image to the right, with these specifications: Colors go green, yellow, green Letter
MATLAB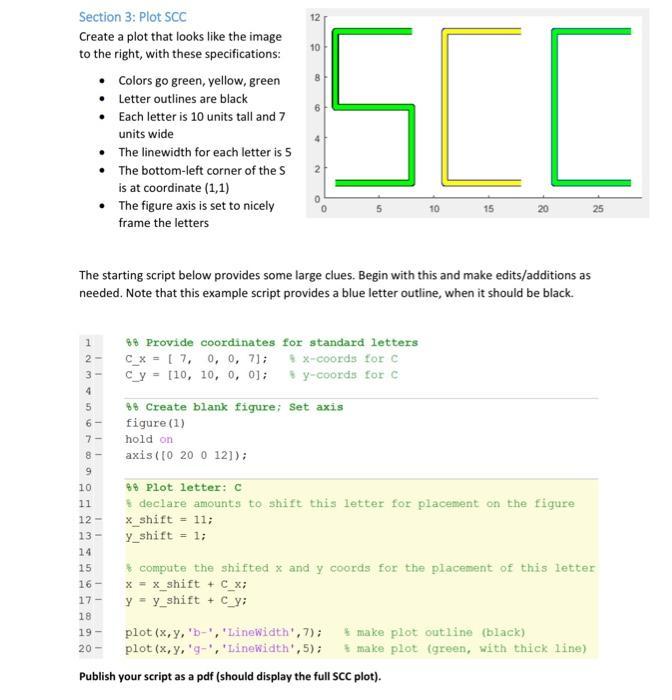
Section 3: Plot SCC Create a plot that looks like the image to the right, with these specifications: Colors go green, yellow, green Letter outlines are black Each letter is 10 units tall and 7 units wide The linewidth for each letter is 5 The bottom-left corner of the S is at coordinate (1,1) The figure axis is set to nicely frame the letters 12 10 16 4 SCO 25 25 The starting script below provides some large clues. Begin with this and make edits/additions as needed. Note that this example script provides a blue letter outline, when it should be black. 1 88 Provide coordinates for standard letters 2 c_x 7, 0, 0, 71; x-coords for C cy [10, 10, 0, 0]; 88 Create blank figure; Set axis y-coords for C figure (1) hold on axis (10 20 0 12]); 9 10 88 Plot letter: C 11 12- 13- declare amounts to shift this letter for placement on the figure x_shift = 11; y_shift = 1; 14 15 16- 17- 18 19- 20 compute the shifted x and y coords for the placement of this letter x = x_shift + C_x; y y shift +C_y; plot (x,y, 'b-', 'LineWidth', 7); plot (x, y, 'g-', 'LineWidth', 5); make plot outline (black) make plot (green, with thick line) Publish your script as a pdf (should display the full SCC plot).
Step by Step Solution
There are 3 Steps involved in it

Get step-by-step solutions from verified subject matter experts