

Question: MATLAB + STATS Submit MATLAB code that can be run section-by-section assuming necessary files are in the search path. The code should be well commented,
MATLAB + STATS
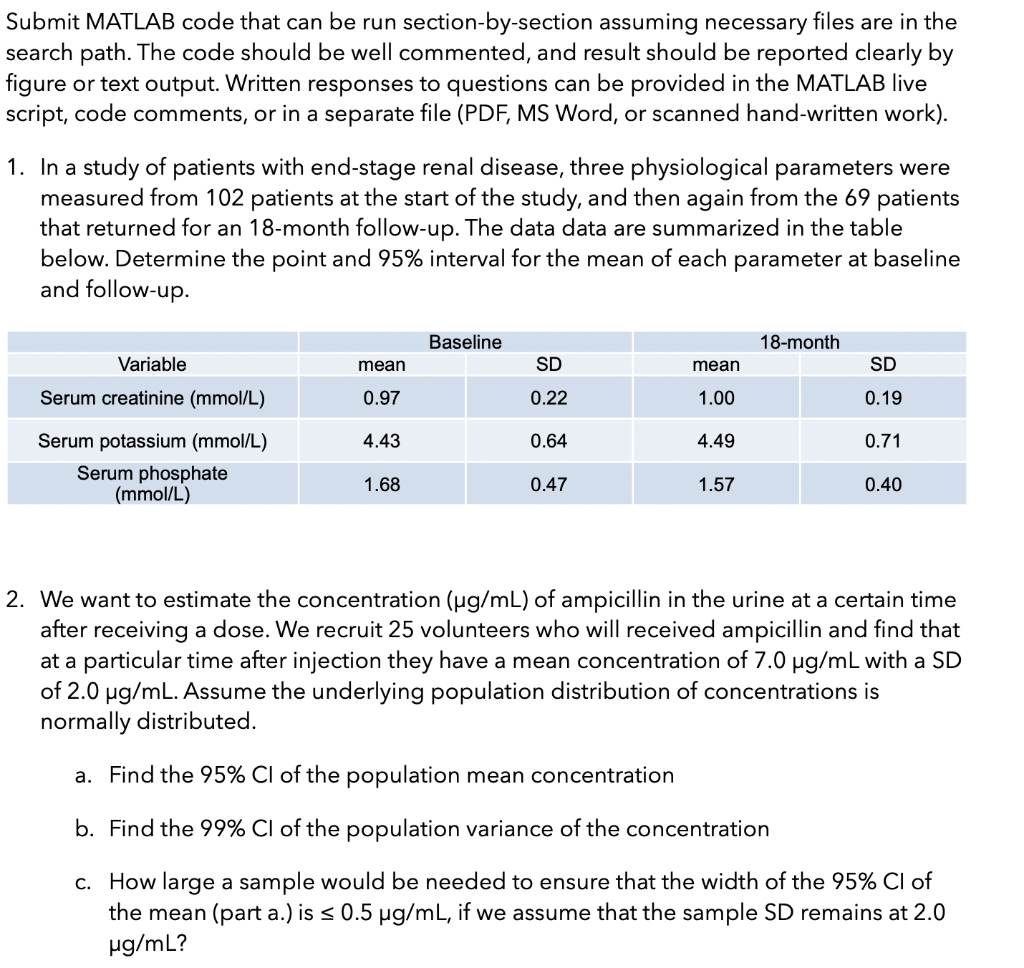
Submit MATLAB code that can be run section-by-section assuming necessary files are in the search path. The code should be well commented, and result should be reported clearly by figure or text output. Written responses to questions can be provided in the MATLAB live script, code comments, or in a separate file (PDF, MS Word, or scanned hand-written work). 1. In a study of patients with end-stage renal disease, three physiological parameters were measured from 102 patients at the start of the study, and then again from the 69 patients that returned for an 18-month follow-up. The data data are summarized in the table below. Determine the point and 95% interval for the mean of each parameter at baseline and follow-up. 2. We want to estimate the concentration (g/mL) of ampicillin in the urine at a certain time after receiving a dose. We recruit 25 volunteers who will received ampicillin and find that at a particular time after injection they have a mean concentration of 7.0g/mL with a SD of 2.0g/mL. Assume the underlying population distribution of concentrations is normally distributed. a. Find the 95%Cl of the population mean concentration b. Find the 99%Cl of the population variance of the concentration c. How large a sample would be needed to ensure that the width of the 95%Cl of the mean (part a.) is 0.5g/mL, if we assume that the sample SD remains at 2.0 g/mL
Step by Step Solution
There are 3 Steps involved in it

Get step-by-step solutions from verified subject matter experts